Using the Savings Plans Cost Reports
Using the Savings Plans Cost Reports
#380680
Overview
Densify provides a set of reports addressing optimization of both, your reserved instance and savings plans utilization. These reports are based on analysis of your billing data. CloudWatch data is also used. Refer to
Open these reports from the AWS RI & Savings Plans drop down menu:
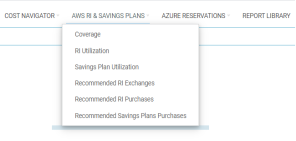
The following reports are provided for savings plans:
- Coverage—This report shows historical usage hours of EC2 instances, comparing on-demand and usage hours covered by reserved instances and savings plans.
- Savings Plans Utilization—This report shows historical utilization of your savings plans.
- Recommended Savings Plans Purchases—This report lists savings plans that can be purchased to improve your coverage and optimize spending.
You can use a combination of these reports to:
- Optimize the utilization of your existing RIs and /or SPs.
- Purchase savings plans to reduce your monthly costs.
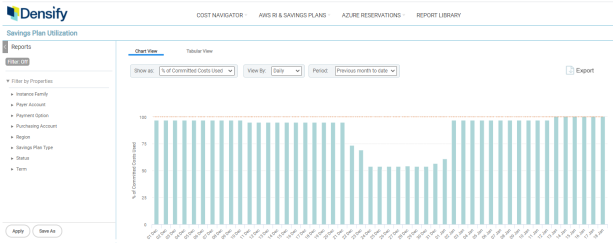
Savings Plan Utilization Report
You can use this report to verify that you are fully utilizing all of your savings plans.
In the bar chart, each bar shows you the percentage of purchased SP hours used by your instances during the specified period of time. The line across the top indicates 100% utilization of all your SPs, which is likley your target, but may not necessarily indicate 100% coverage of your actual utilization.
Table: SP Utilization Report Options
|
Setting |
Default |
Description |
|---|---|---|
|
Show as |
% of Committed Cost Used |
Use the following options to select how you want to view your data in the Savings Plan Utilization report.
|
|
View by |
Daily |
The unit of time on which to base the report. Select Daily, Weekly, Monthly, Quarterly or Yearly. |
|
Period |
Previous Month to Date |
Select the period on which you want to report. There are a number of pre-defined options as well as the option to customize a date range. Note: Note: Data for the SP Utilization report is available only from the date after your instance is upgraded to v12.1.10. |
You can filter the scope of systems on which the report is based, using the filtering options on the left side of the page. See
The tabular report allows you to view the detailed data. The table is sorted on the % Utilization and both used and unused costs are displayed so you can view and compare how the individual savings plans are being used.

You can export the chart or the tabular report for further review. See
Recommended Savings Plan Purchases Report
AWS Savings Plans provide another option to reduce your cloud spending. Instead of committing to a specific instance type you commit to an hourly spend amount, in dollars. If you are have both RIs and SPs, the savings plans will be applied towards On-Demand usage that is not already covered by RIs. Savings Plans are more flexible than RIs but must still be used strategically to maximize your savings.
When analyzing for savings plan recommendations Densify considers your existing RIs and SPs. Densify first applies any existing RIs and SPs to your historical usage and then determines the optimal amount of savings plans for the remaining on-demand usage.
This report requires a significant amount of data to be analyzed and may require several minutes to load. For this reason, you must first define the report filter settings on the left side of the page and then generate the report.
Consider exchanging any unused or under-utilized reserved instances before purchasing any additional savings plans. A link on this page will take you to the Recommended RI Exchange report.
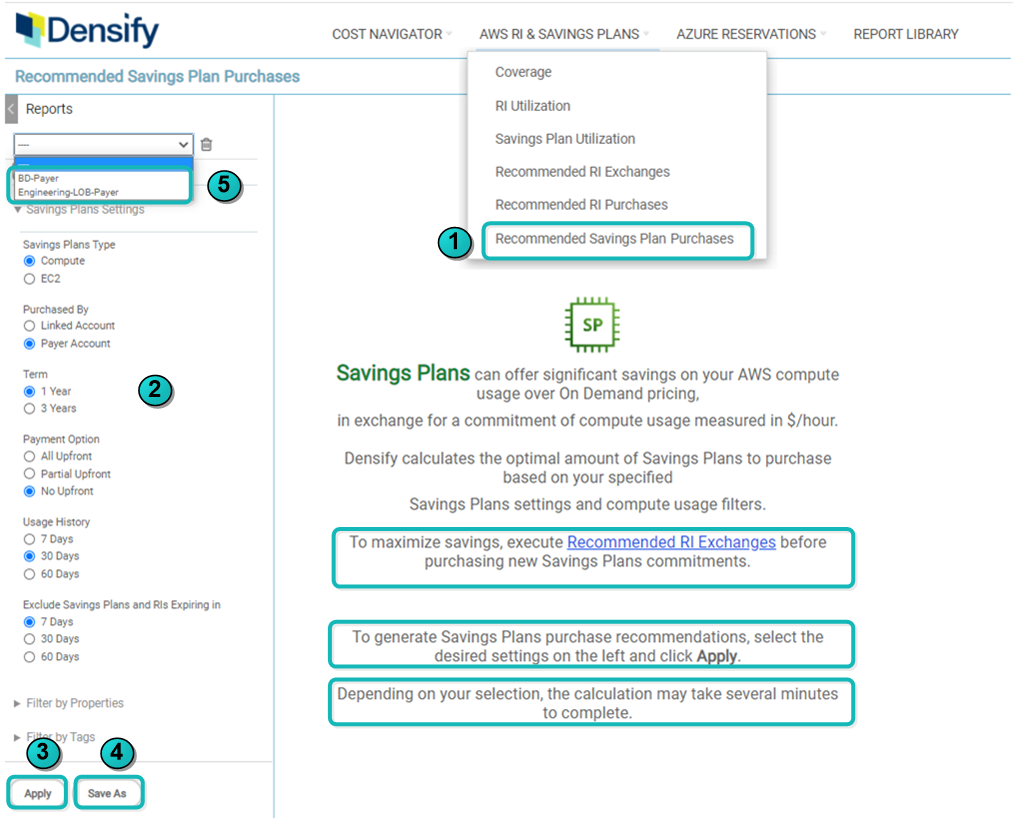
- In the RI and Saving Plans menu, click the Recommended Savings Plan Purchases report.
- On the left side of the page select the settings and filtering options to define the scope of the report. See Savings Plan Settings for details.
- Click Apply to generate the report. Depending on your reports settings and filtering selections, the report may take few minutes to generate.
- If there is no data that meets your filtering criteria and report settings, a message will be displayed.
- If you have the correct number of savings plans for your environment then a message indicating there are no recommendations will be displayed
- Click Save and enter a name for the report. Once saved you can select your saved settings and filtering selections. If you make any changes click Save again to save these changes to the existing report.
- To open a saved report, select it from the drop down list and click Apply, to load the settings and the corresponding report data.

You can change the filtering options to review other options, i.e. Compute vs EC2, 1 year vs 3 years, All Upfront vs No Upfront.
You can export these reports to a .PDF file format. Click the Export button in the upper right corner of the page to see the export options for the displayed reports. Review and update the filename before saving the file, exports from the same page/report will have the same filename and will overwrite an existing saved report. See
Summary Bar
A summary of the proposed changes and potential cost savings is provided at the top of the list.
Table: Summary Bar Details
|
Value |
Description |
|---|---|
|
Purchase |
The number of savings plans that need to be purchased to improve coverage and provide significant cost savings. |
|
Savings Plans for Monthly Commitment |
This is the value of the savings plan to be purchased. The cost per hour is shown. |
|
Monthly Savings |
These are the monthly savings that can be achieved if the SP is correctly applied within you accounts. |
Purchase Recommendations
The details of the proposed recommendation are provided below the summary.
These recommendations are based on the report settings on the left side of the page. See Savings Plan Settings for details.
Table: Recommendation Details
|
Value |
Description |
|---|---|
|
Properties |
The specific properties of SP to be purchased are listed in the first column. |
|
Recommendations |
The details of how the SP should be applied to your current usage are provided. Any special considerations are also provided. |
|
Estimated Costs and Savings |
These are the monthly savings that can be achieved if the recommended SP is correctly applied within you accounts. any incidental costs are also listed here. |
|
Show Purchase Details |
The specific details of the recommended savings plan. |
Table: Purchase Details
|
Value |
Description |
|---|---|
|
Linked Account |
These are the accounts that are linked to the selected payer account. This column is only displayed if you have set the Purchased By setting to "Linked Account". |
|
Instance Family |
This is the instance family for which the recommended SP should be purchased. |
|
Predicted On Demand Costs ($/hr) |
Based on your current usage, and any existing RI's or SPs that are already being applied to this account, this is the predicted on-demand cost that you will pay, if the recommended savings plans are not purchased. In other words, this is the remaining on-demand usage that can be covered by a savings plan. |
|
Savings Plans Commitment ($/hr) |
This is the cost of the recommended savings plan in $/hr. If you are able to purchase this amount of savings plans then you will attain the optimal savings, based on the last 30 days, or 60 days of historical data, as defined by the report settings. See Savings Plan Settings for details. |
|
On Demand Costs with Savings Plans ($/hr) |
This is the residual on-demand cost that is still not covered by an RI or SP. This remaining amount does not need to be covered by an RI or SP, and in fact you may end up wasting the SP, if you try to cover this residual cost. This maybe the case if this last bit of usage is spiking or inconsistent. Again, this is based on the last 30 days, or 60 days of historical data. |
|
Total Costs with Savings Plans ($/hr) |
This would be your hourly cost if you purchased the recommended savings plan and it is applied to your predicted on-demand usage. |
|
Savings ($/hr) |
This would be your hourly savings if the recommended Savings plans is applied to your predicted on-demand usage. (Predicted On Demand Costs - Total Costs with Savings Plans ) |
|
Monthly Savings ($) |
This would be your total monthly savings based on total monthly hours of usage multiplied by the savings in $/hr. |
|
Savings (%) |
This is your total monthly savings expressed a percentage. |
|
Upfront Costs for Savings Plans ($) |
This is upfront cost for the recommended savings plan, if applicable. |
|
Monthly Recurring Costs for Savings Plans ($) |
This will be your monthly cost for the recommended savings plans. This value can vary based on the SP payment options and duration of the SP. See Savings Plan Settings for details. |
The following options are available for the Recommended Savings Plans Purchases report. These settings are used by the Densify SP analysis to generate the savings plan purchase recommendations. For example, if you want to your purchase recommendations to be be based on the following: Compute savings plan, 1-year, No-Upfront-costs, with usage to be analysed per linked account, then you need to specify the settings here.
Table: Savings Plans Settings
|
Setting |
Description |
Default |
|---|---|---|
|
Savings Plan Type |
Allows you to set the type of savings plans to be used in the report. |
Compute |
|
Purchased By |
Allows you to set the account used to buy the SP, for the report. |
Payer Account |
|
Term |
Allows you to set the term of the purchased SPs, to be used in the report. |
1-Year |
|
Payment Option |
Allows you to set the payment option, to be used in the report. |
No Upfront |
|
Usage History |
Specify the number of days of data on which the purchase recommendations should be based. |
30 Days |
|
Exclude Savings Plans and RIs Expiring in (days) |
Since Densify first applies any existing RIs and SPs to your historical usage and then determines the optimal amount of savings plans for the remaining on-demand usage, you may eant to exclude SPs and RIs that are expiring soon. You can specify the number of days that the SP and RI should be considered for exchange, before it expires. |
7 Days |
Savings Plan Filters
Properties and tags on the left side of the console allow you to further define a subset of data to review. As a best practice, you want to narrow the scope as much as possible, for this report, to improve loading and updating of the report. You can filter on:
- Properties—These include specific savings plan properties that can be set at the time of purchase. See AWS Filtering Options, for a list of the AWS properties. Not all AWS properties are supported for savings plans;
- Tags—These are user-defined values for resource tags. The value of the resource tag is displayed and can be used for filtering. i.e. application:WebServer, where "application" is the resource tag and "Webserver" is the user-defined value. You must map your AWS Resource tags to Densify attributes so the tags will be included in the analyses. Additionally, when configuring the cost and usage report for billing data collection, you must include resource IDs. Contact [email protected] for details.
When the filtering options are enabled, the filtering criteria are indicated in purple, so that you always have a clear indication that you are viewing a subset of data and what options are included in the displayed report. See
You can save various version of custom-filtered reports for later review. Click the Save As button, enter a unique name and then save your custom-filtered reports for later review.
Last Updated: June 2024
|
|
|
|
|
|
|