Using the Azure Reservations Cost Reports
Using the Azure Reservations Cost Reports
#380710
Overview
Azure reservation discounts adhere to a "use-it-or-lose-it" policy. If you do not have matching resources using the reservation for any hour, then you lose a quantity of your purchased reservation for that hour. Densify provides a set of reports addressing utilization and optimization of your reservations. These reports are based on analysis of your billing data.
Before beginning you must have created a connection and configured your Azure subscriptions to provided reader access to the application and each of the reservations. See
Open these reports from the Azure Reservations drop down menu:
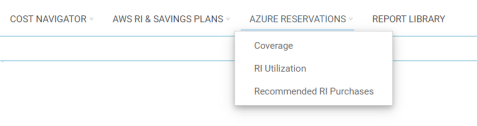
The following reports are provided:
- Reservation Coverage—This report shows historical usage hours of your instances, comparing on-demand and usage hours covered by reservations.
- Reservation Utilization—This report shows historical utilization of your reservations.
- Recommended RI Purchases—This report lists reservations that can be purchased to improve your coverage.
You can use a combination of these reports to:
- Optimize the utilization of your existing reservations;
- Purchase additional reservations to reduce your monthly costs;
- Review proposed recommendations for additional reservation purchases.
Exporting Reports
You can export the graphical reports to a .PDF file format and the tabular reports to .CSV file format. Click the Export button in the upper right corner of the page to see the export options for the displayed reports. See
Filtering Data
You can filter the scope of systems on which the report is based, using the filtering options on the left side of the page. See
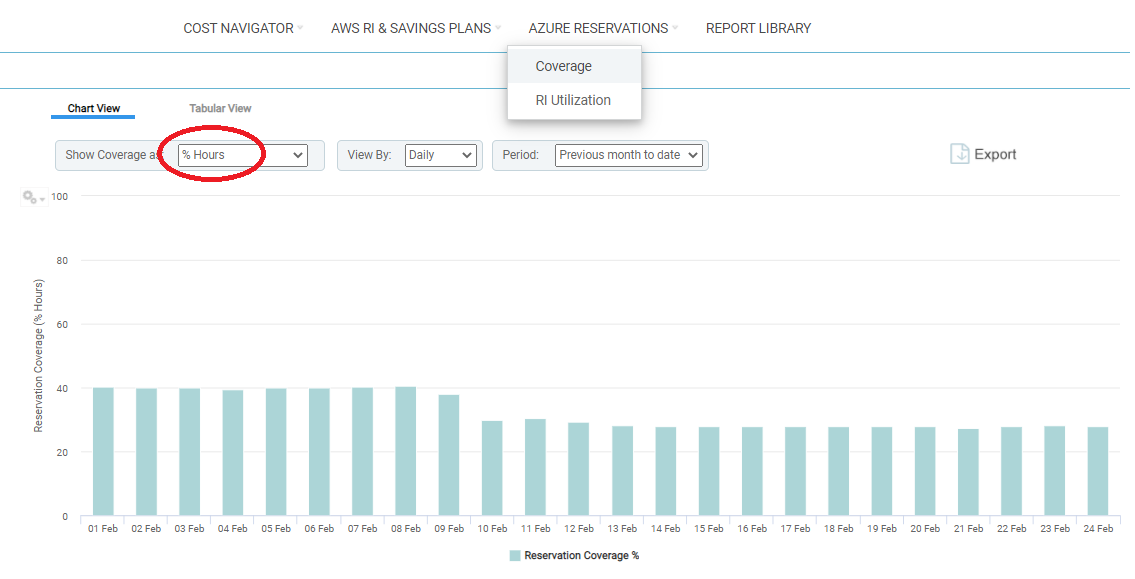
The Coverage report shows you the number of instances that are covered by your purchased reservations. Based on your existing coverage, this reports help you to determine if you need additional reservations. If your coverage is 100% this indicates that you have purchased reservations for all instances that can be covered.
This report does not indicate if you have too many reservations, that are not being used. That information is provided in the Utilization report. This report also does not indicate if you have the correct type of reservations for your environment. If you have 100% coverage and 100% utilization, then your environment has the correct number and type of reservations.
Three grouping options are provided to configure this report.
Table: Reservation Coverage Report Options
|
Setting |
Default |
Description |
|---|---|---|
|
Grouping Options |
||
|
Show Coverage as |
% Hours |
Use the following options to select how you want to view your usage data in the Coverage reports. These options show you the portion of usage hours being covered by a reservation.
The normalization factor allows you to convert various instance sizes to a single "base size" and then apply the discount accordingly. Instance size flexibility is applied from the smallest to the largest instance size within the instance family based on the normalization factor. If you have purchased one Azure Reserved Instance for a D2s_v3, then the following instances could be covered if they are in the same region: 1 Std_D2S_v3 or 1/2 Std_D4s_v3 or 1/4 Std_D8s_v3, etc. Refer to the Azure documentation for details of normalization factors. The legend at the bottom of the chart defines the colour-coding for the bars. |
|
View by |
Daily |
The unit of time on which to base the report. Select Daily, Weekly, Monthly, Quarterly or Yearly. Note: Weekly is not available for the Coverage report. |
|
Period |
Previous Month to Date |
The period on which you want to report. There are a number of pre-defined options as well as the option to customize a date range. |
|
Filter by Properties |
||
|
Filter by Properties |
You can filter the scope of systems on which the report is based, using the filtering options on the left side of the page. See |
|
If you select "% Hours", you may see coverage decreasing over time.
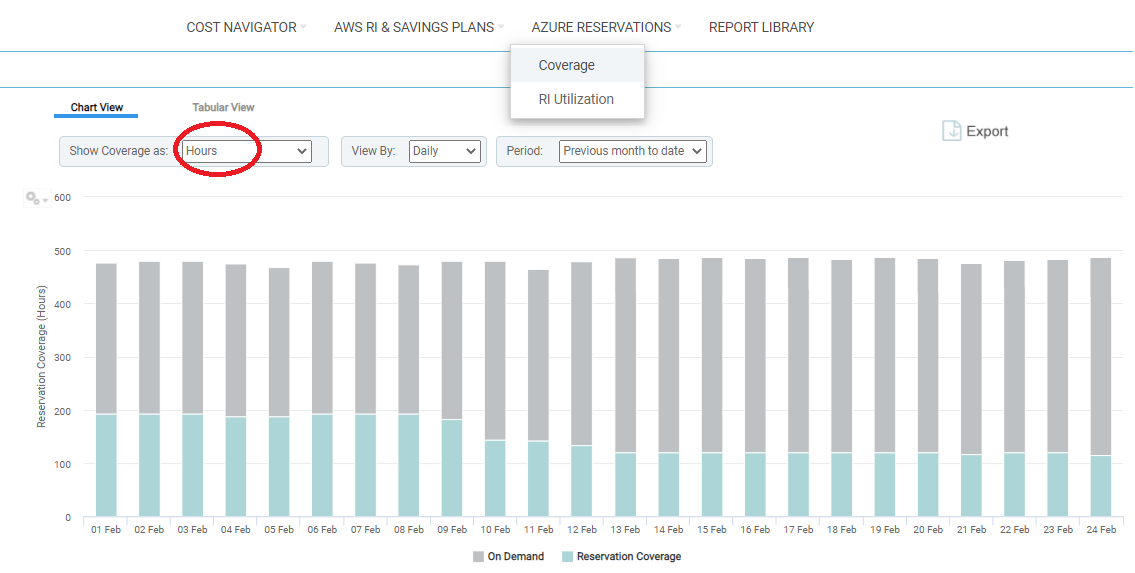
When you select actual "Hours", you can see that you are using fewer discounted hours, while usage remains about the same, so more usage is being billed at on-demand rates. This view shows your coverage decreasing due to reservations expiring over time.
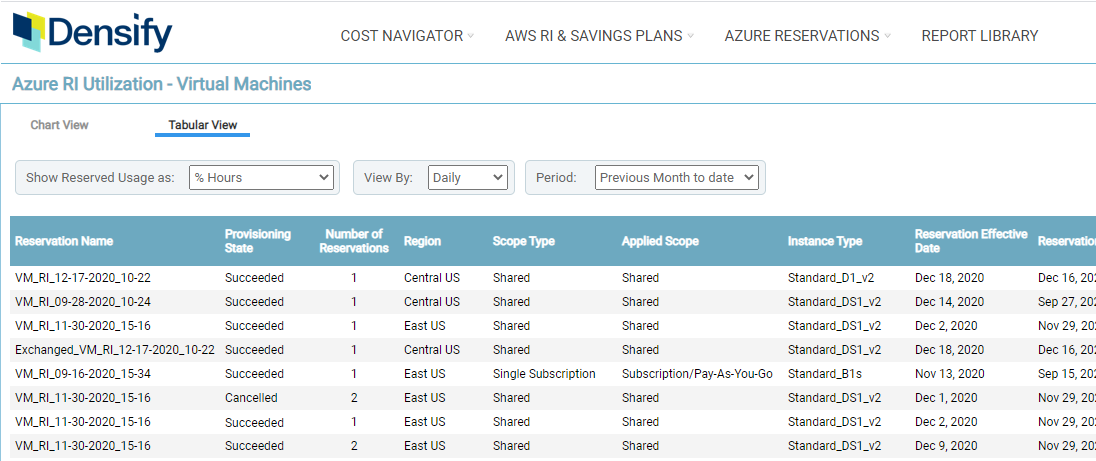
The tabular report shows you the detailed data. The table shows one line per group, where the grouping is based on matching criteria such as payer account, region, instance type, OS, and tenancy.
The table contains both hours and normalized hours and the corresponding percentages. You can export the report for further review. See
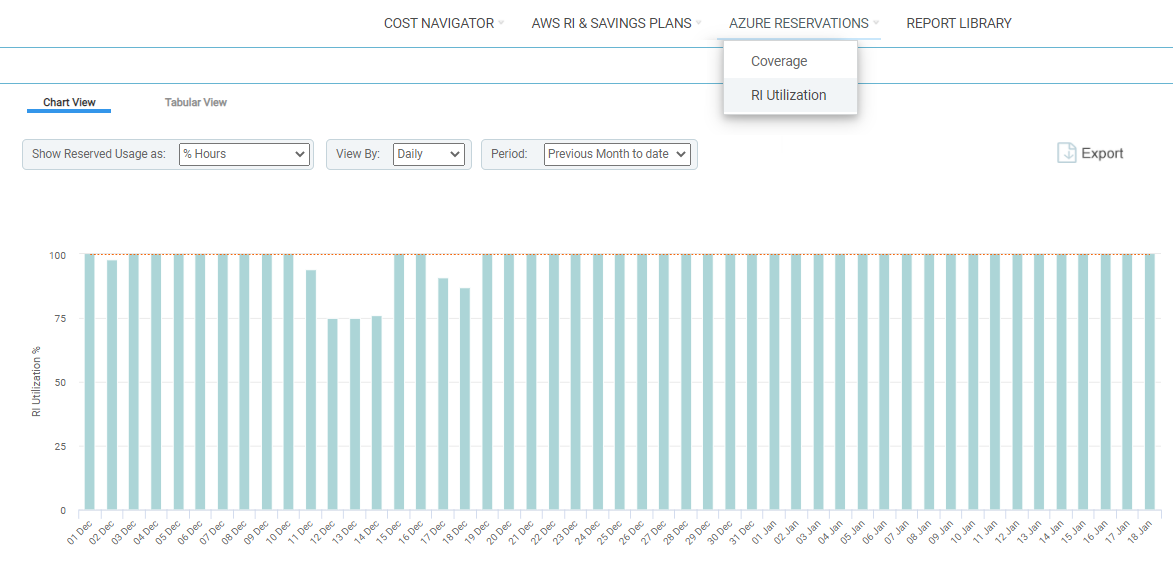
This report shows you how effectively your purchased reservations are being used.
Note: Note: Azure uses the term 'RI' only for virtual machine reservations. This report shows only Azure VM reservations. See RI Utilization Report for the AWS Reserved Instance report.
In the bar chart, each bar shows you the percentage of purchased reservations hours used by your instances during the specified period of time. The line across the top indicates 100% utilization, meaning all of your reservations are fully utilized.
You can use this report to view opportunities to increase the usage of already purchased reservations by either modifying the reservations or moving workloads to better match your active reservations.
There are 3 options to configure this report:
Table: Reservation Utilization Report Options
|
Setting |
Default |
Description |
|---|---|---|
|
Grouping Options |
||
|
Show Coverage as (Utilization Report) |
% Hours |
Use the following options to select how you want to view your usage data in the Utilization and Coverage reports. These options show you the portion of usage hours being covered by a reservation.
The normalization factor allows you to convert various instance sizes to a single "base size" and then apply the discount accordingly. Seethe examples, above. The legend at the bottom of the chart defines the colour-coding for the bars. |
|
View by |
Daily |
The unit of time on which to base the report. Select Daily, Weekly, Monthly, Quarterly or Yearly. Note: Weekly is not available for the Coverage report. |
|
Period |
Previous Month to Date |
The period on which you want to report. There are a number of pre-defined options as well as the option to customize a date range. |
|
Filter by Properties |
||
|
Filter by Properties |
You can filter the scope of systems on which the report is based, using the filtering options on the left side of the page. See |
|
You can filter the scope of systems on which the report is based, using the filtering options on the left side of the page. See
The tabular report allows you to view the detailed data. The table is sorted on the % Utilization and both hours and normalized hours are displayed so you can view and compare individual reservations. You can also export the report for further review.
Recommended RI Purchases Report
Densify reviews your exisiting reservations and any recently purchased reservations and lists the recommends additional reservation purchases to improve your coverage.
Breadcrumbs
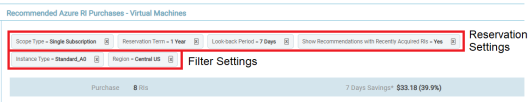
The number and type of recommended reservations to purchase are based on the settings you have defined for the report. You will see the selected report setting as "breadcrumbs" at the top of this report.
If you apply any filters, these are also displayed at the top of the page. You can disable a filter by clicking the x at the end of the item, from this bar.
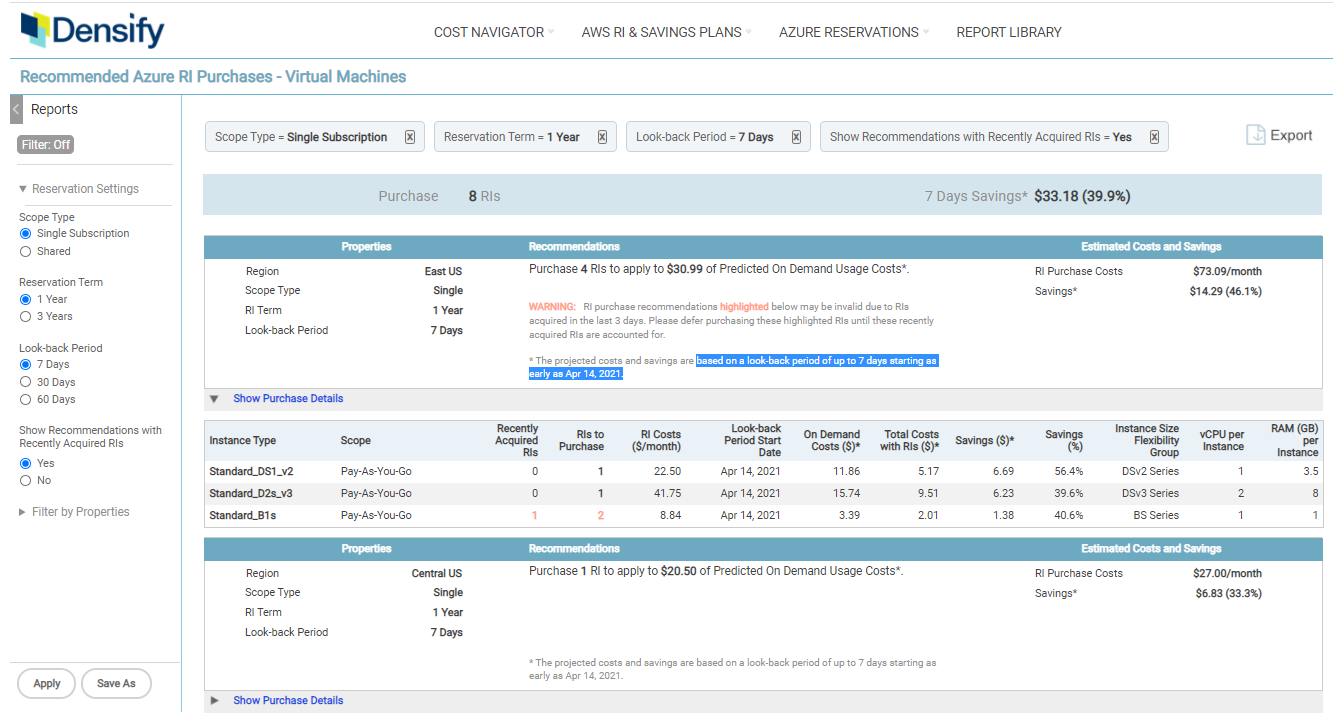
Summary Banner
A summary of the proposed changes and potential cost savings is provided at the top of the page.
Table: Summary Bar Details
|
Value |
Description |
|---|---|
|
Purchase |
The number of reservations to purchase based on utilization and the number of existing reservations. |
|
7-Day Savings |
This is the total savings that can be achieved if you purchase the recommended reservations. The savings are based on the Look-back Period you defined for the report. |
Reservation Settings
Use the report configuration options at the left side of the page to define the type of reservations you prefer to purchase. Densify uses these settings when making the purchase recommendations.
Table: Reservation Settings
|
Setting |
Description |
Default |
|---|---|---|
|
Reservation Settings |
||
|
Scope Type |
Specify how the reservation should be applied: to a single subscription, or shared. |
Single Subscription |
|
Reservation Term |
Specify the term of the reservation. Select from 1 or 3 years. The term affects the discount amount. |
1 Year |
|
Look-back Period |
Specify the number of days of data on which the purchase recommendations should be based. Select one of 7, 30 or 60 days. The projected costs and savings are based on this look-back period. |
7 Days |
|
Show Recommendations with Recently Acquired RIs |
Indicates that Densify should include any recently purchased reservations (within the past 3 days), that are not yet in use. If set to "Yes" and there are any recently purchased reservations, then a warning message is displayed indicating, the purchase recommendations may be invalid due to recently purchased or exchanged reservations. You may want to defer any purchases until these recently acquired reservations are applied. See Using the Azure Reservations Cost Reports, below. If you select "No", and there are any recently purchased reservations, they are ignored and the warning message is not displayed. |
Yes |
|
Filter by Properties |
||
|
Filter by Properties |
You can filter the scope of systems on which the report is based, using the filtering options on the left side of the page. See |
|
Reviewing the Recommendations
This report lists the recommended reservations. Each block provides the following details for the recommended purchase:
Table: Recommendation Details
|
Value |
Description |
|---|---|
|
Properties |
|
|
Region |
The region in which the reservation can be used. |
|
Scope Type |
This is how the reservation should be applied within your subscription. |
|
RI Term |
The the term of the reservation. |
|
Look-back Period |
The number of days of data on which the purchase recommendations is based. The projected costs and savings are based on a look-back period. |
|
Recommendations |
|
|
Details |
Details of the purchase recommendation, including any warnings and notes. See below for details of the warning message. |
|
Estimated Cost and Savings |
|
|
The monthly cost of the reservation purchase. |
|
|
Savings |
This is the dollar amount you will save if you make the proposed changes. These savings are based on the look-back period. If 7 days is selected the savings are for those 7 days.The percentage, in brackets, is the savings over the on-demand cost of the selected instance type. The asterisk indicates that the savings listed here, are based on the defined look-back period. The entries in this report are sorted by this value, with the reservation purchase that provides the greatest cost savings, displayed at the top of the list. |
Click Show Details to expand each block to see the details of the changes that are required to obtain the optimal set of RIs.
- Click the Show Details link to expand the box and review the details of the required changes.
- Review the details of the instance type and the potential cost savings.
- Click Export to generate a .PDF file that can be distributed to stakeholders.
A warning message is displayed if you have recently purchased reservations that have not yet been applied to existing demand. See Using the Azure Reservations Cost Reports, below.
Table: Purchase Details
|
Value |
Description |
|---|---|
|
Instance Type |
The instance type of the reservation to purchase. |
|
Scope Type |
The subscription to which the reservation will be applied. |
|
Recently Acquired RIs |
The number of recently acquired reservations that match this recommendation. |
|
RI Costs ($/month) |
This is the cost per instance type reservation. This column provides a breakdown of the RI Purchase Cost, in the first block of information. |
|
Look-back Period Start Date |
The start date of the number of days that are analyzed for this recommendation. The projected costs and savings are based on the look-back period. |
|
On Demand Costs ($) |
This is the on-demand cost of the instances that will benefit from the recommended reservation purchase. |
|
On Costs with RIs ($) |
This is the cost of the instances once the recommended reservation has been applied. |
|
Savings ($) | Savings (%) |
The difference between the On Demand Costs and the On Costs with RIs, expressed in dollars and as a percentage. |
|
Instance Size Flexibility Group |
If the reservation is size-flexible, and can be applied to all of the instance types in a group. This is the name of that group. |
|
vCPU per Instance |
This is the resulting vCPU allocation. |
|
RAM (GB) per Instance |
This is the resulting memory allocation. |
Recently Purchased Reservations
A warning message is displayed if you have recently purchased or exhanged reservations that have not yet been applied to existing demand. These recently acquired reservations are highlighted in orange as are the corresponding purchase recommendation(s). These newly acquired reservations may impact the recommendations, so you may want to defer purchasing similar reservations until the recently purchased reservations are applied to your usage and appear on your bill.
Note: Note: The Service principal that is being used for data collection must be added to the reservation order so that Densify can collect the reservation details. See CRB-50221 for details of the matching logic.
By default, Densify looks back 3 days to see if any reservations were recently purchased or exhanged. For example, if the report is generated on May 10th, then anything between 2021-05-07 00:00:00 and 2021-05-09 23:59:59 will be considered active.
Note: Note: Reservations from today (2021-04-09) are not included, as the requisite data has not yet been collected.
A number of commonly used reports are provided in the Reports drop down menu. The data set is not filtered. The data is grouped as indicated in the report title and there are View By and Period selectors set.
These reports can be customized for your specific use case. You can also adjust the filtering criteria as required and then save your report with a new name.
Click the Save As button at the bottom of the page and enter a unique name and then save your custom-filtered reports for later review.
Filter settings are not persisted between reports, so it is highly recommended that you create and save the settings and reports that you commonly use.
The following reservation reports are available from this menu:
Table: Azure Reservations Pre-Defined Reports
|
Report Name |
Description |
Show Reserved Usage As |
View By |
Period |
|
Azure Reservation Utilization (Daily) |
Reservation utilization showing utilization as % Hours and shown for each day up to the current day of the current month. |
% Hours |
Daily |
Previous Month-to-Date |
|
Azure Reservation Utilization (Monthly) |
Reservation utilization showing utilization as % Hours and shown for each month up to the current day of the current month. |
% Hours |
Monthly |
Previous Month-to-Date |
Last Updated: June 2024
|
|
|
|
|
|
|