Optimizing Your Containers
Optimizing Your Containers
#380520
Overview
Densify's workload sizing and stacking capabilities enable it to learn the utilization patterns of your containers and their pods and determine the optimal request and limit values to ensure that pods get their required resources, while enabling the containers to run at higher utilization.
When working with these reports, keep in mind that a request is the amount of CPU or memory resources that the system will guarantee for the container. Kubernetes will use this value to decide on which node to place the pod. A limit is the maximum amount of resources that Kubernetes will allow the container to use. If the node is not resource constrained, Kubernetes may allow the container to exceed the limit. These are OS configuration settings, and are not configurable through Densify.
Use the Containers menu to review and optimize your container instances. This menu item is only displayed when you have collected and loaded container utilization data. Contact [email protected] for details.
The data on this dashboard is displayed on four tabs:
- Summary—Provides an overview of your container environment.
- Data—Provides detailed tabular view of your data. You can dynamically group the data by various attributes, search and hide columns in the table.
- Cluster Breakdown—Provides a breakdown by cluster showing current and recommended requests and limits for both CPU and memory.
- Namespace Breakdown—Provides a breakdown by namespace showing current and recommended requests and limits for both CPU and memory.
You can reach the following pages using the links on the Summary tab or the Data tab:
- Analysis—Provides a set of histograms that allow you to visualize your analysis results.
- Details—Provides details of requests and limits for both CPU and memory and the proposed optimization recommendation. You can reach this page using the links on the Summary tab or the Data tab.
Three sections provide a visual overview of your environments.
Note: Containers with "Optimization Type=No Data" are filtered out from all of the reports on all Container tabs.
Using the Container Filter
You can apply various filters to customize the scope of containers you are reviewing. See
When you export the content of a report with filters applied, the filtered set of systems is exported for the Cluster Breakdown and the Namespace Breakdown tabs.
Note: The functionality is not available on the Kubernetes Details tab.
Collecting Container Utilization Data
Refer to
Exporting Tabular Data
You can export the content from the Cluster Breakdown, Namespace Breakdown and Data tabs to .CSV or .XLSX format. See
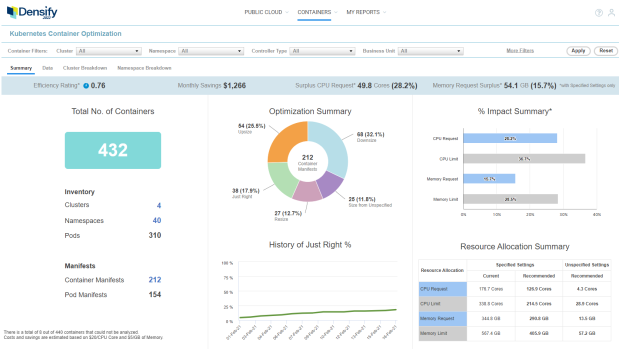
The summary overview provides a number of charts and tables to show you potential savings in your container environments.
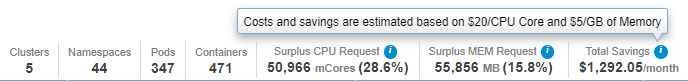
Key metrics are displayed in a banner at the top of the report.
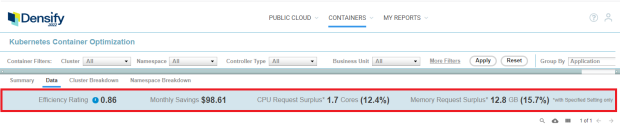
Table: Summary Banner
|
Column |
Description |
|---|---|
|
Efficiency Rating |
The Efficiency Rating provides an indication of the health of your aggregated environment. The value is indicated in red, when it is greater than 1.
|
|
Monthly Savings |
This is the estimated monthly savings for the selected environment. If you have created and applied filters, the totals, displayed in this summary, reflect the defined filters. The estimated cost savings are calculated by converting the CPU and Memory reduction into hardware savings based on the cost of the surplus CPU cores and MB of memory. The cost per core and per GB of memory is configurableContact [email protected] for details. . |
|
CPU Request Surplus (Cores) and Percentage |
This is the aggregated total CPU | Memory Request Surplus in mCores or GB. The values are also shown as a percentage. This is calculated as (Current CPU or Memory Request - Recommended CPU or Memory Request) * Current Count) of the filtered list. The percentage is calculated as (Surplus/Current value)*100. Containers with unspecified CPU | Memory Requests are excluded from these metrics. Surplus and Surplus% can be a 0 or positive values. The asterisk (*), on these values as well as on the % Impact Summary bar chart, indicates that these values do not include containers with requests set to "Unspecified". Since these containers are sized based on availability of resources, it is not meaningful to compare them to containers with defined request and limit settings. The last column in the Resource Allocation Summary table provides a summary of the containers with Unspecified Settings. |
|
Memory Request Surplus (GB) and Percentage |
The cost per core and per GB of memory is configurable.
This table shows you the total number of containers within the analyzed environments. Inventory is then broken down by clusters, namespaces and pods.
In the inventory section, the total count for clusters, namespaces and pods are listed. The count for Clusters and Namespaces are provided as links. Click the value to navigate to the Cluster Breakdown tab or the Namespace Breakdown tab.
ReplicaSets are counted as a single item even if they are not running. The CPU Request | Limit and Memory Request | Limit values (0) are displayed on the Details tab, but are not included when rolled up to the Cluster Breakdown tab or the Namespace Breakdown tab nor any reports in the Summary tab.
The Manifest summary lists the total number of manifests for containers that are managed by a replication controller and how many are not managed via the controller (i.e. standalone pods). Click the value to navigate to the Analysis tab.
A footnote at the very bottom, shows you the number of containers that have been analyzed out of the total number of containers in your environment.
This pie chart shows the breakdown of container manifest recommendations by Optimization Type: upsize, downsize, resize, size from unspecified. See Container Optimization Types for descriptions of the various recommendation types.
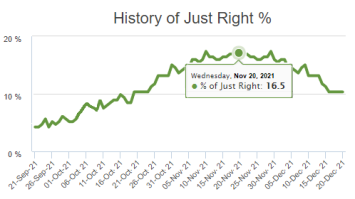
The line chart at the bottom, of this section shows the number of container manifests that are sized correctly over time. The axis scales based on the amount of data up to the maximum of 6 months. If you hover over any data point in the graph a popup indicates the percentage of systems that are "Just Right" and the date. As you apply the recommendations, the number of right-sized container manifests should increase over time.
This bar chart shows the potential percentage improvement in container resource allocations when the Densify recommendations have been actioned.
The table at the bottom shows the current settings and the recommended settings for both CPU and memory. Values are aggregated to show the total increase or decrease of required resources. In this table, the values are converted automatically to the next larger or smaller unit, so that values are easy to read:
- MB > GB > TB > PB (each step is divided by 1,024);
- mCores > Cores > KCores > MCores (each step is divided 1,000).
Reviewing the Cluster Breakdown
Another Cluster Breakdown tab is shown on the Data tab. The set of data is similar but allows you to view only the subset of data selected on the main part of the Data tab. See Optimizing Your Containers - Data Tab.
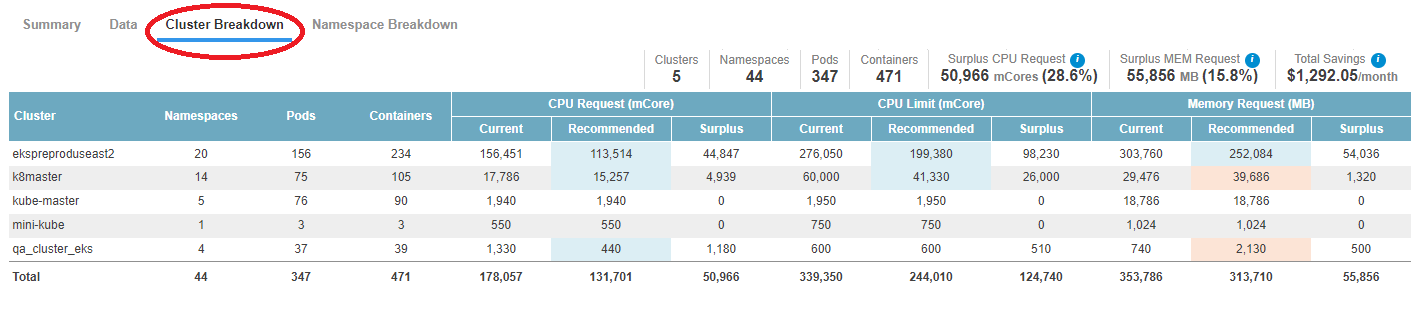
A summary of the running totals is displayed in the upper right corner at the top of each of the following pages Cluster Breakdown tab, Namespace Breakdown tab and the Details tab.The Information icon, on these values indicates that these values do not include containers with requests set to "Unspecified". In this case, 'unspecified" means there are no request or limit values specified in the container manifest file for CPU and/or memory.
Since these containers ("Unspecified") are sized based on resource availability, it is not meaningful to compare them to containers that do have defined request and/or limit settings.
If you have created and applied filters, the totals, displayed in this summary, reflect the defined filters. This bar is not displayed if no data is available due to filter settings or lack of collected data.
This block of information contains the following details:
Table: Running Total Summary
|
Column |
Description |
|---|---|
|
Clusters |
This is the number of unique clusters within the filtered selection. |
|
Namespaces |
This is the number of unique namespaces in the clusters that are within the filtered selection. The value is the number of unique clusters/namespace combinations within the filtered selection. A namespace with the same name can appear in more than one cluster, but the naming combination of clusters-namespace makes the namespace uniqu. |
|
Pods |
This is the number of unique pods within the filtered selection. The displayed value is the number of unique (clusters/namespaces/pod combinations). multiplied by the Current Count. If Current Count is 0, then a value of 1 is used as the multiplier. |
|
Containers |
This is the number of unique containers based on the filtered selection. Since there can be more than one container within a pod and each container is listed in a separate row within the tabular report, this count is based on unique cluster/namespace/pod/container combinations. The displayed value is the number of unique (cluster/namespace/pod/container combinations) multiplied by the Current Count. If Current Count is 0, then a value of 1 is used as the multiplier. |
|
CPU Request Surplus (mCore) |
This is the aggregated total CPU Request Surplus. This value is calculated as (Current CPU Request - Recommended CPU Request) * Current Count) of the filtered records. Containers with unspecified CPU Requests, i.e. Current Value is null, are excluded. Surplus and Surplus% can be a 0 or positive values. The value displayed here may also be different than the value displayed in the table. See the note below. A tooltip |
|
CPU Request Surplus (%) |
This is the aggregated total CPU Request Surplus reported as a percentage. This is calculated as (Surplus/Current value)*100. |
|
Memory Request (MB) |
This is the aggregated total Memory Request Surplus. This is calculated as (Current Memory Request - Recommended Memory Request) * Current Count) of the filtered records. Containers with unspecified CPU Memory Requests, i.e. Current Value is null, are excluded. Surplus and Surplus% can be a 0 or positive values. |
|
Memory Request Surplus (%) |
This is the aggregated total Memory Request Surplus reported as a percentage. This is calculated as (Surplus/Current value)*100. A tooltip |
|
Total Savings ($/month) |
This is the aggregated monthly savings for all clusters, if the suggested recommendations are made. A tooltip |
 on this value, indicates that only containers with specified CPU settings are included in this total.
Note: When comparing the summary bar values and the tabular content you may see that the value in the column, CPU Request (mCores) > Surplus is lower than the Summary bar > CPU Request Surplus value. This may be the case if the CPU or memory request value is not specified in the container manifest. Densify considers the value to be 0 in the calculation, and as a result, the surplus for the containers with unspecified values will have a negative surplus value, so the Surplus in the table is always smaller or equal to the Surplus on the Summary bar, which does not include containers with unspecified request and/or limits.
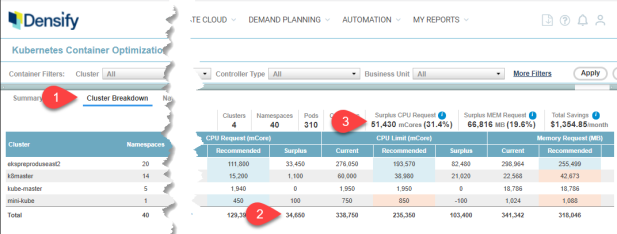
Cluster Breakdown Report
The Cluster Breakdown tab lists all of the clusters discovered in your environment. A single row for each cluster is provided with the following details:
Table: Cluster Breakdown Report
|
Column |
Description |
|---|---|
|
Cluster |
This is the cluster name. |
|
Namespaces |
This is the number of namespaces within the named cluster. |
|
Pods |
This is the number of pods within the named cluster. |
|
Containers |
This is the number of containers within the named cluster. You can have multiple containers per pod and multiple pods per namespace. |
|
CPU Request (mCore) |
These columns provide the Current and Recommended allocation, as well as the surplus, if any. The surplus is calculated as (Current value minus Recommended value). If the value is negative, this indicates a shortage. These results only include resources with specified requests and limits. In both the CPU Request | Limit and Memory Request | Limit Current columns, if the current value is unspecified, then the current value is shown as "0". The Recommended column is colour-coded if there is a corresponding upsize or downsize recommendation. |
|
CPU Limit (mCore) |
|
|
Memory Request (MB) |
|
|
Memory Limit (MB) |
|
|
Container Manifest |
This is the number of manifests that reference this container. |
Table: Recommendation Colour-Coding
|
Setting Optimization Type |
Description |
|---|---|
|
Upsize |
The recommended setting is greater than the current setting. e.g. CPU | Memory Request | Limit current value < CPU | Memory Request | Limit recommended value. |
|
Downsize |
The recommended setting is less than the current setting. e.g. CPU | Memory Request | Limit current value > CPU | Memory Request | Limit recommended value. |
The Namespace Breakdown tab lists all of the namespaces within a cluster. The report is sorted in alphabetic order by Cluster Name and then Namespace.
Note: The ability to sort by other columns will be available in a future release.
The number of rows shown in this report corresponds to the Cluster Breakdown report > Namespace column. When the content of this report increases beyond the full height of the screen, a scroll-bar is displayed on the right side of the page.
A single row for each namespace is provided with the following details:
|
Column |
Description |
|---|---|
|
Cluster |
This is the name of the parent cluster. The cluster name may be the same for many namespaces, since you can have multiple namespaces in a single cluster. |
|
Namespace |
This is the name of the namespaces. |
|
Pods |
This is the number of pods within the namespace. |
|
Containers |
This is the number of containers within the namespace. |
|
CPU Request (mCore) |
These columns provide the Current and Recommended allocation, as well as the surplus, if any. The surplus is calculated as (Current value-Recommended value). If the value is negative, this indicates a shortage. These results only include resources with specified requests and limits. In both the CPU Request | Limit and Memory Request | Limit > Current columns, if the current value is unspecified, then "0" is shown as the current value. |
|
CPU Limit (mCore) |
|
|
CPU Surplus (mCore) |
|
|
Memory Request (MB) |
|
|
Memory Limit (MB) |
|
|
Memory Surplus (MB) |
|
|
Container Manifest |
This is the number of manifests that reference this container. |
Page Navigation
When there are more rows than can be displayed in a single page, pagination links are displayed in the upper left corner of the page. Click the link to move to the next page. Use these page links to navigate between pages of the report.
Click the Back ( ) button, in the top-right corner of the page, to return to the parent dashboard. Do not use the browser's Back button for navigation within Densify. You will be logged out of your session. See
Automating Densify's Recommendation
Densify provides an automation strategy that allows container optimization to be initiated from the source files rather than from an external orchestration solution. Densify provides a set of APIs and integration modules to enable automation. Contact [email protected] for details.
Last Updated: June 2024
|
|
|
|
|
|
|