Using the Metrics Viewer for Containers
Using the Metrics Viewer for Containers
#380930
The Densify metrics viewer allows you to view your collected and analyzed time series data to review specific container details. You can use the metrics viewer to investigate details when deciding whether to action specific recommendations.
This topic covers metrics viewer when reviewing your Kubernetes containers.
See
Page Navigation
Access the metrics viewer from the Optimizing Your Containers - Details Tab.
Use the Back button in the top-right corner of the page to return to the parent optimization details page. Do not use the browser's Back button for navigation within Densify as this exits Densify.
Clicking the icon in the parent optimization details page opens the metrics viewer showing the selected instance. The page opens with either the default or saved filter settings, if you are within the same session.
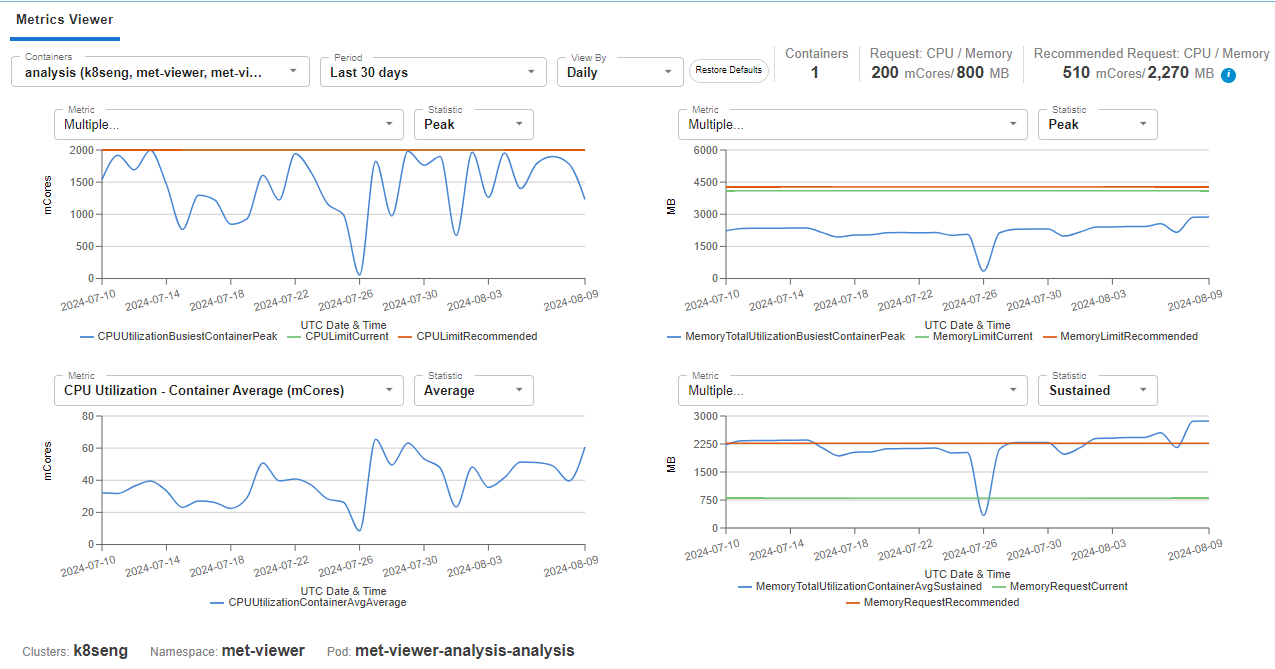
Metrics Viewer Controls
When you open the metrics viewer, the instance that was selected in the Instance Optimization Details page is displayed. You can also select another container from the drop down menu.. You can now configure the data you want to view for this container using the options in the dropdown controls.

There are 3 options to configure this report:
Table: Metrics Viewer Controls
|
Setting |
Default |
Description |
|---|---|---|
|
Containers |
Last selected container from the Optimization Details page |
This dropdown list is populated with the container from the Optimization Details page from where the metrics viewer was opened. i.e. all of the containers displayed in the tabular report in the upper pane, are available here. Containers in this list are named using the convention <container (cluster, namespace, controller pod>. The selected container is at the top of the list and the rest are listed in alphabetical order. You can select one container to review. To search for a specific container enter the name of the containers, as you type, matching strings are displayed in the list. You can also paste a string into this field and if a match exists, it is displayed. Only the containers from the parent Instance Optimization Details page are searched. |
|
Period |
Last 30 Days |
Select the period on which you want to report. There are 4 pre-defined options as well as the option to customize a date range. Select "Other" and enter your start and end dates in the calendar. Click Apply to close the calendar and update the charts with the new period. Note: Densify retains up to 3 months of historical data for the metrics viewer. When creating a customized period, you cannot view data older than 90 days. If a recommendation has been implemented that results in a container configuration change during the selected period, you may observe data missing from the charts. See Relearning Workload Patterns. |
|
View By |
Daily |
Select the unit of time to use for displaying the data. In this initial release, you can select hourly or daily. The option to display hourly data is only available when the date range is less than 7-days. When reporting on more than 7-days, only the daily option is available. |
|
|
|
Click this button to reset all of the settings to their default values. You will be prompted and then the menu options are reset and the charts are refreshed accordingly using the default values. |

All of the charts, are refreshed immediately when you change any of the control options. Your settings are saved for the current user session and are returned to the default values if you log out or if another user opens the metrics viewer.
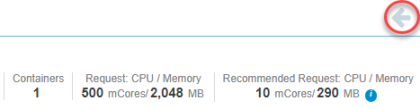
Details of the selected instance are displayed in the upper right corner of the page.
Clicking on the icon  on the Recommended Request displays the details of the recommended container sizing.
Configuring the Individual Charts
You can configure each of the 4 charts separately using the 2 dropdown controls above each chart.
Table: Metrics Viewer Chart Controls
|
Setting |
Options |
Description |
|---|---|---|
|
Metrics |
See Table: Container Metrics, below for options. |
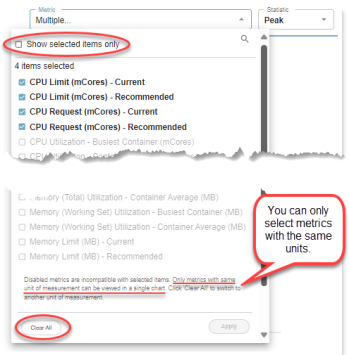
This dropdown list is populated with metrics that can be added to the selected chart. Select or remove any metrics and click Apply to update the chart. See below for the list of available metrics. Metrics that are not compatible with the selected items are disabled (greyed out). Only metrics with the same units can be viewed in a single chart. Click Clear All to clear the current selections and enable all metrics. You can now select other metrics with the same units. This also clears the Show selected items only box. Use the search feature to find a specific metric. Check the Show selected items only box to hide the list of other metrics. If this option is enabled and you use the search feature, only items that are shown in this list are searched. Disable this box to search all metrics. |
|
Statistic |
|
Select the workload scoring strategies to be plotted on the chart. Peak, Sustained and Average are selected by default. Minimum is the other available option. See Quartiles in the Resource Utilization Charts for details of how peak, sustained, etc are determined. A legend below each chart shows the line colour that corresponds to the statistic. |
The line chart shows the selected metric plotted by the hour or date.
The X-axis scales based on the amount of data up to the maximum of 90-days. The X-axis will show both date and hour when the date range includes less than 7-days. Only the date is shown when there are more than 7-days of data on the chart.
If you hover over any data point in the graph a popup indicates the values on the selected date. You can slide the mouse along the plotted lines to see data values at the specific date or time.
If metric data is not available, the message NA: <Metric><Statistic> is shown in the legend of the impacted chart.
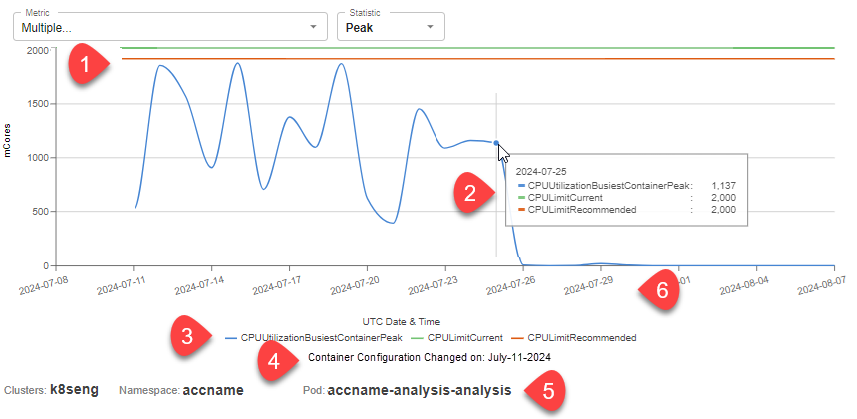
Where:
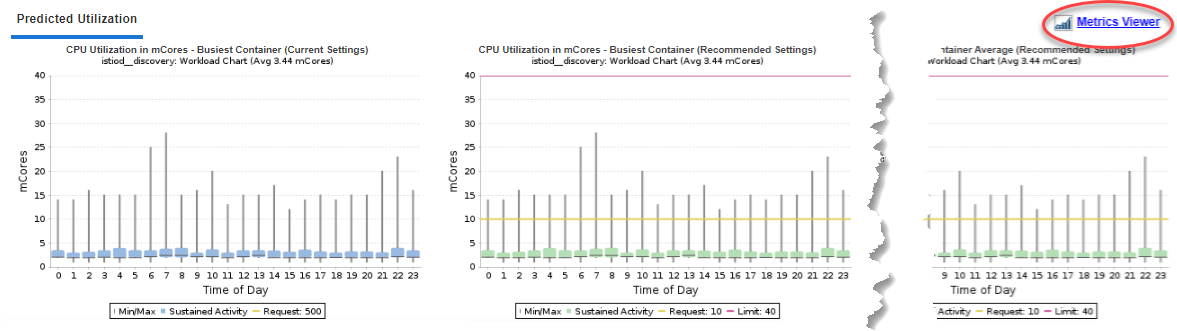
- CPU and memory request and limit values are shown as straight lines.
- Tool tip indicating specific values on the selected date
- Legend
- Date on which the container configuration changed, if applicable
- A footnote listing the following details: Cluster, Namespace, Pod
Relearning Workload
If a recommendation has been implemented that results in an instance type change during the selected period, you may observe data missing from the charts.
If the selected container has been recently optimized. (i.e. changed configuration), then any historical data that was collected before the instance type was changed is not displayed. A footnote indicating the change is displayed, under the legend: "Container Configuration Updated On: MMM-DD-YYYY" See Figure: Chart Details, above.
Possible data inconsistency issues may result from the following situations:
- The value of "Container Configuration Updated On" information is from the system attributes table which is only refreshed by the weekly RDB populate, so there may be a discrepancy or data inconsistency if, for example, the configuration was changed 2 days ago and the RDB was refreshed 5 days ago.
- Densify shows the last time that the configuration changed. If the container configuration has changed 3 times during the selected period, the note shows the date of the most recent change.
See Relearning Workload Patterns for more details on using this feature.
The following tables list the complete set of metrics that you can review in the metrics viewer.
Table: Container Metrics
|
Metrics |
Units |
|---|---|
|
CPU Limit - Current |
mCores |
|
CPU Limit - Recommended |
mCores |
|
CPU Request - Current |
mCores |
|
CPU Request - Recommended |
mCores |
|
CPU Utilization - Busiest Container |
mCores |
|
CPU Utilization - Container Average |
mCores |
|
Disk I/O - Busiest Container |
Kbytes/s |
|
Memory (RSS) Utilization - Busiest Container |
MB |
|
Memory (RSS) Utilization - Container Average |
MB |
|
Memory (Total) Utilization - Busiest Container |
MB |
|
Memory (Total) Utilization - Container Average |
MB |
|
Memory (Working Set) Utilization - Busiest Container |
MB |
|
Memory (Working Set) Utilization - Container Average |
MB |
|
Memory Limit - Current |
MB |
|
Memory Limit - Recommended |
MB |
|
Memory Request - Current |
MB |
|
Memory Request - Recommended |
MB |
|
No. of Containers |
Number |
|
No. of Restarts |
Number |
When selected, recommended CPU and memory request and limit values are shown as a straight line regardless of which statistics (Peak/Sustained/Average/Min) have been selected.
These metrics will be indicated in the legend. See Figure: Chart Details, above.