Optimizing Your Containers - Details Tab
Optimizing Your Containers - Details Tab
#380640
The Kubernetes Container Optimization Details report displays detailed information for the selected container (row) from the source page:
- On the Summary tab click the "Container Manifests" link > then click the Details tab
- From the Data tab click any of the count links > then click the Details tab.
Note: Containers that do not have adequate collected data for recommendation analysis are not included on the Details tab.
Page Navigation
Click the Back ( ) button, in the top-right corner of the page, to return to the parent dashboard. Do not use the browser's Back button for navigation within Densify. You will be logged out of your session. See
This dashboard consists of:
- A tabular report—The columns of the tabular report are listed in the Table: Container Details Tabular Columns below.
- Predicted Utilization Charts—Based on the container selected in the top pane the lower pane shows the corresponding resource utilization charts.
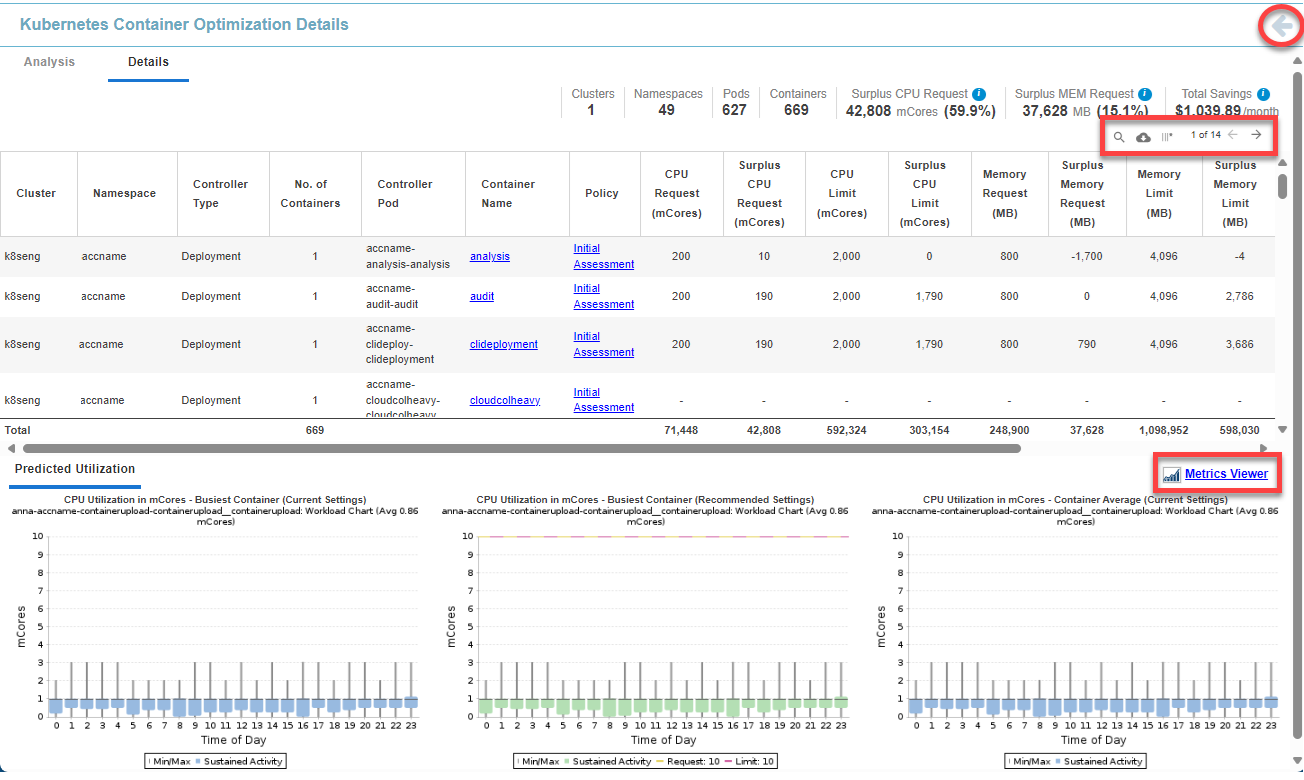
Reviewing the Container Details Page
Summary totals are displayed in the upper right corner of the page. These totals are for the systems displayed on the current page and not all analyzed containers.
The information icon, on the Surplus CPU Request/Surplus Memory Request and Net Savings values indicates that these values do not include containers with requests set to "Unspecified". See Optimizing Your Containers.

Note: When exported to .CSV the Total Savings value may not match the value in the exported .CSV file because the .CSV format does not support formulas and the total savings are a calculation per line, of the number of containers multiplied by savings.
You can use the following options for managing and viewing your data more effectively.


By default the table is sorted by cluster name. You can sort the content of this table using any of the available columns, by clicking the column header.
- Click the column header to sort the table, in ascending order, using the content of the selected table as the sort key.
- Click the column header again, to sort the table, in descending order, again using the content of the selected column as the sort key.
- Click the column header a third time to clear the sort and return to the default, sorted by Cluster.
An up/down arrow is displayed in the column header to indicate the column is being used to sort the content of the table.
Sorting is not persistent between pages, tabs or login sessions.
When the page is initially loaded, this table is sorted alphabetically, by Cluster name, Namespace, Controller/Pod and then Container Name.
The content of the table as well as the totals at the bottom reflect the settings in both the Recommendation Filter and the Container Filter.
Table: Container Details Tabular Columns
|
Component/Column Name |
Description |
|---|---|
|
Cluster |
The parent cluster containing the pods. |
|
Namespace |
The namespace associated with the container. This allows you to logically group your pods. |
|
Controller Type |
The controller type that monitors and maintains the state of your cluster. This can be one of DaemonSet, Deployment, ReplicaSet, ReplicationController, StatefulSet, etc. |
|
No. of Containers |
This is the current number of containers running in the selected cluster/namespace/pod combination. The total number of containers is listed at the bottom of the column. This value is used to calculate totals for Requested and Limits for current and recommended CPU and memory values. This total is also listed in the running total at the top of the page. |
|
Controller Pod |
This is the name of the controller or pod. You can have one or more containers per pod. |
|
Container Name |
This is the name of the container. The container name is a hyperlink that opens the metrics viewer |
|
Policy |
This is the name of policy used to analyze this container's utilization data. The policy is a hyperlink that opens the Optimization Policies tab |
|
CPU Request (mCores) Memory Request (MB) CPU Limit (mCores) Memory Limit (MB) |
The current requested and limit CPU | memory values for the selected container are displayed in these columns. The total, listed at the bottom of the Request and Limit columns for both CPU and Memory, is calculated as (current value * No. of Containers). This formula is also used for CPU Limit and Memory Limit. For containers where the current CPU value is unspecified a dash (-) is displayed in the main table and '0' is displayed in the "Total" row. |
|
Total CPU Request (mCores) |
This is the total CPU request value for the container and is calculated as (current value * No. of Containers). For containers where the current CPU value is unspecified a dash (-) is displayed in the main table and '0' is displayed in this column. This column is hidden by default. You can enable it for display, as required. See Data Controls, above. |
|
Uptime % |
Uptime % is the total time the container has been running as a percentage of the total hours since the container was deployed. (Running Hrs/Total Hrs) When using pay-per-use pricing models, the amount of time each instance has been running, is required to accurately estimate future costs. The predicted uptime (%) for a cloud instance or container, is based on the percentage of hours CPU utilization data is present in the historical interval, as specified in the policy settings for the entity. For Auto Scaling groups and VM Scale Sets and Individual child instances are not taken into account. Predicted uptime %, for new instances or containers, that started mid-way through the historical interval, is calculated from the time/date that the instance was started as opposed to the beginning of the interval, resulting in more accurate predictions for future usage. For example, the uptime is the number of hours that have "CPU Utilization in mcores", and the range is the lesser of when the container was discovered, or the range defined in the policy. Looking at a specific container that was discovered on Jan 5th 2024, that has workload of 42 hours since that date, then the uptime % is 42 hrs/(13 days x 24 hrs/day) = 13.4%. This is the value shown in this column. |
|
Restarts - Last Day |
The total number of restarts of all containers associated with the deployment, in the last day. A dash (-) is displayed if no data has been collected. This column is hidden by default. You can enable it for display, as required. See Data Controls, above. |
|
Restart |
The total number of restarts of all containers associated with the deployment, in the last 7 days. A dash (-) is displayed if no data has been collected. |
|
Memory Limit Event |
Indicates if the peak working set memory utilization was near or exceeded the memory limit in the last 7 days. A value of "No" indicates:
|
|
Total Hrs |
The total hours are determined by calculating the duration from the time the first container, as defined by the manifest, starts, until the point that Densify analyzes the specified containers. Total hours continues to increment until the manifest is no longer discovered by Densify. This column is hidden by default. You can enable it for display, as required. See Data Controls, above. |
|
Running Hrs |
Running hours is the number of hours of CPU utilization data from any running containers, as defined by the container manifest. The number of running containers is not used when determining the number of running hours. i.e. 3 containers are running from 2pm to 6pm, then “Running Hours” will be 4 hrs. This column is hidden by default. You can enable it for display, as required. See Data Controls, above. |
|
Optimization Type |
Identifies the overall result of the optimization analysis. Values are colour-coded and the possible colours are listed in Container Optimization Types, below. This column is hidden by default. You can enable it for display, as required. See Data Controls, above. |
|
Recom. CPU Request (mCores) Recom. Memory Request (MB) Recom. CPU Limit (mCores) Recom. Memory Limit (MB) |
The recommended request and limit CPU | memory values for this container are displayed in these columns. The total, listed at the bottom of the Request and Limit columns for both CPU and Memory, is calculated as (Current CPU Request * Current Count). This formula is also used for CPU Limit and Memory Limit. After a configuration change is detected, recommended request and limit values for both CPU and memory will be populated with the current CPU and memory request and limit values during the workload invalidation period. This column is hidden by default. You can enable it for display, as required. See Data Controls, above. |
|
Surplus CPU Request (mCores) Surplus Memory Request (MB) Surplus CPU Limit (mCores) Surplus Memory Limit (MB) |
The surplus is the difference between the current and the recommended values. If the current value is unspecified, then the surplus value will be negative (i.e. 0 - recommended value). |
|
Total Memory Request (MB) |
This is the total memory request value for the container and is calculated as (current value * No. of Containers). For containers where the current CPU value is unspecified a dash (-) is displayed in the main table and '0' is displayed in this column. This column is hidden by default. You can enable it for display, as required. See Data Controls, above. |
|
Savings per Container ($/month) |
If the recommendations are implemented, the total savings per container is indicated here. This value is calculated as the total savings/number of containers. When exported to .CSV the total of this column may not match the value in the exported file because the .CSV format does not support formulas.
This column is hidden by default. You can enable it for display, as required. See Data Controls, above. |
|
Total Savings ($/month) |
The total savings can be achieved if the recommendations are implemented. This value is calculated as the current estimated cost minus the estimated cost of the recommended instances. Calculated as: (Savings per Container ($/month) * No of Containers When exported to .CSV the total of this column may not match the value in the exported file because the .CSV format does not support formulas.
|
|
# of Nodes |
This is the number of nodes used by this container. You can hover over the cell to see the list of all node name(s) in which this container(s) reside(s). This column is hidden by default. You can enable it for display, as required. See Data Controls, above. |
|
A value in this column indicates the instance type (cloud) or instance request/limit values (container) has been change recently. The workload for this instance, on which the recommendation is based, includes only the days of data from the indicated date to the current date. All historical data for this instance, collected prior to the indicated date is not included in the analysis. Previous data has been excluded because it was based on the previous instance type (cloud) or instance request/limit values (container). A blank cell indicates the current instance type has not changed and all available workload data within the range, defined by the policy, has been used to generate the recommendation. Contact [email protected] to enable this feature. See Relearning Workload Patterns for more details. This column is hidden by default. You can enable it for display, as required. See Data Controls, above. |
|
|
Shown in bold at the bottom of the table, the totals for each column for all the records in the filtered tabular report. The total, listed at the bottom of the Request and Limit columns for both CPU and Memory, is calculated as (Current CPU Request * Current Count). This formula is also used for CPU Limit, Memory Request and Memory Limit. The total, listed at the bottom of the Surplus columns for both CPU and Memory, is calculated as: (Current - Recommended). If the value of any row is unspecified, then that value is treated as "0" when summing the values for the total. |
Note: The following details are not included in this report: Disk Allocations (Current | Recommended), Individual Disk Partitions at Risk, Disk Usage and Parent.
Densify container recommendations are categorized into optimization types, which are based on recommended sizing for the CPU Request, CPU Limit, Memory Request, and Memory Limit settings. See the table below for a description of each container optimization type.
Table: Container Optimization Type Summary
|
Optimization Type |
Description |
|---|---|
|
Just Right |
This container manifest or task definition is optimally configured for the workload. There are no resizing recommendations. |
|
Upsize |
Densify recommends increasing one or more of CPU Request, CPU Limit, Memory Request, or Memory Limit settings. An "Upsize" optimization type has no recommendations to decrease any container CPU or memory request or limit settings. For example, Densify assigns an "Upsize" optimization type if a container manifest or task definition has the following aggregate optimization recommendations:
|
|
Downsize |
Densify recommends decreasing one or more of CPU Request, CPU Limit, Memory Request, or Memory Limit settings. A "Downsize" optimization type does not have any size increase recommendations for any request or limit settings. For example, Densify assigns a "Downsize" optimization types for the following aggregate recommendations:
|
|
Resize |
Densify recommends resizing at least two of CPU Request, CPU Limit, Memory Request, or Memory Limit settings. For the "Resize" optimization type, there is at least one increase recommendation and at least one decrease recommendation. For example, Densify assigns a "Resize" optimization type if a container has the following recommendations:
|
|
Size from Unspecified |
Sizing recommendations are made without current CPU Request, CPU Limit, Memory Request, and Memory Limit values. For "Size from Unspecified" optimization type, there is at least one sizing recommendation from an unspecified setting and no decreasing or increasing size recommendations for any container request or limit settings. For example, Densify assigns a "Size from Unspecified" optimization type if a container has the following recommendations:
|
|
No Data |
There is insufficient data to recommend changes to CPU Request, CPU Limit, Memory Request, or Memory Limit values. |
Reviewing the Predicted Utilization Charts
Clicking on any row in the tabular report, in the upper pane, shows predicted utilization details in the Predicted Utilization Metrics tab, in the lower pane.
- Metrics Viewer—The link in the upper right corner of the lower pane, opens the metrics viewer. You can use the metrics viewer to investigate details when deciding whether to action specific recommendations. See Using the Metrics Viewer for Containers.
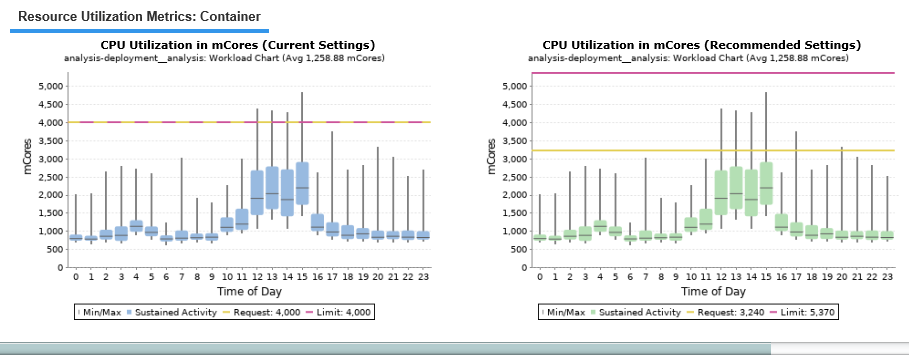
- Workload Charts—Show hourly min/max and sustained activity for the selected system. The charts show the current and the recommended settings for selected workloads Use the left/right arrows to scroll though the displayed workload charts. The following charts are available:
|
|
Note: If the required metrics are not available, the corresponding charts are not displayed.
If the optimization type of the selected container is "Just Right", then only charts showing the current utilization are displayed. i.e. no recommended charts would be the same so are not displayed.
Understanding the Workload Charts
Workload charts display current sustained activity in blue, while sustained activity on the recommended request settings chart is shown in green. The minimum and maximum utilization values are shown as vertical lines above and below the coloured block. The median is indicated as a black line within the coloured block. The average is indicated in brackets in the subtitle of the chart.
The Y-axis is scaled dynamically to match the range of data. The yellow line indicating the request setting is shown and the setting of the Y-axis scale also accounts for the request setting. The pink line indicates the limit. If the request and the limit are the same, the dashed yellow/pink line indicates the value. The units of the workload are also shown on the Y-axis.
Using Policy Settings to Select Utilization Metrics
The Kubernetes Optimization policy settings allow you to analyze requests and limits based on different utilization metrics, e.g. Memory request analyzed based on Actual Memory Utilization and Memory Limit analyzed based on Raw Memory Utilization. If these policy settings have been enabled the corresponding charts will indicate the selected metric settings.
Contact [email protected] for details on enabling these settings.
Relearning Workloads
If a container instance has been optimized (i.e. limits or request values have been changed based on a recommendation), then the next day you will see the Optimization Type set to "Just Right" and since the required data (as defined by the policy) has not been accumulated, it will show the recommended request and limit values for both CPU and memory will be populated with the current CPU and memory request and limit values during the workload invalidation period, on the Resource Utilization Metrics tab.
See the column, Container Configuration Updated On, above for more details.
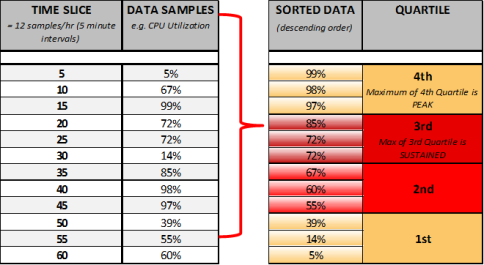
Understanding the Quartiles in the Resource Utilization Charts
In charts, workload data for each system is shown in four different bars (two yellow and two red), called quartiles, to show minimum, average, sustained and peak values. When used in the analysis, quartiles provide a good representation of system activity because the weighted scoring for sustained and peak activity produces a more accurate assessment of workload utilization patterns and requirements.
Quartiles are calculated in the following manner:
- Workload activity is collected every five minutes, which totals 12 times per hour.
- The 12 values are then re-ordered in descending order and separated into equal sample sizes (quartiles), with each quartile having three values. Each quartile represents 25% of operational time.
- The bottom of the first quartile shows the minimum value, the next quartile shows average values, the top of the third quartile shows the sustained value and the top of the fourth quartile shows the peak value.
Understanding the Memory Metrics
Densify Collects 3 memory metric types from cAdvisor:
container_memory_usage_bytes
This metric:
- Provides the size of the overall memory used, regardless of whether it is used for mapping from disk or for memory allocation.
- Includes both RSS (memory not used to map files from the disk) as well as the page cache (uses memory exclusively to map files from the disk), so in effect this metric counts memory access indiscriminately of its purpose.
-
Measures the current memory usage, including all memory regardless of when it was accessed.
Table: container_memory_usage_bytes
|
Usage |
Description |
|
DensifyWorkload metric name: |
Memory Utilization |
|
Densify uses this metric for: |
Default policy settings for Requests and Limits:
|
container_memory_working_set
This metric:
- When this metric hits the MEM limit an OOMkill occurs.
- WSS = Working Set Size, also called, current working set.
- Represents the minimum amount of memory a process needs to keep running during a period of time.
- Includes the active files cache.
- Unlike fixed metrics like "cache" or "buffer", which have specific values in our operating systems, the working set is a calculated value determined in various ways.
- cAdvisor calculates the working set as follows: total memory usage - inactive files
- It includes all anonymous (non-file-backed) memory since Kubernetes does not support swap.
- The metric typically also includes some cached (file-backed) memory, because the host OS cannot always reclaim such pages.
- container_memory_usage_bytes is ≥ container_memory_working_set.
Table: container_memory_usage_bytes
|
Usage |
Description |
|
DensifyWorkload metric name: |
Memory Working Set |
|
Densify uses this metric for: |
Not curently used. It will be used for detecting hidden process kills, in a future release. |
container_memory_rss
This metric:
- Represents the amount of physical memory that a process has in the main memory that doesn’t correspond to anything on disk.
- Typically includes stacks, heaps, and anonymous memory maps.
- Size of memory not used for mapping files from the disk
- Number of bytes of anonymous and swap cache memory (includes transparent hugepages).
- Container_memory_rss container_memory_working_set