Exporting Report Data
Exporting to Excel
#380120
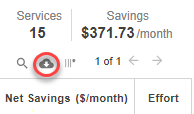
You can export most tabular reports to Microsoft® Excel . Dashboards and drill-down pages that support export functionality have the export to Excel icon available in the toolbar. You may also see the download to CSV icon
The following options are covered here:
- Exporting Data from Public Cloud reports;
- Exporting Data from Container dashboards;
Exporting Public Cloud Tabular Reports
Note: The pop-up blocker must be turned off for Densify in all supported browsers.
The process below and any limitations are the same for all public and private cloud tabular reports.
- In the Densify Console navigate to the cloud report you want to export.
- Define the scope of your report, if applicable. For example, using one or more of the following filters:
- Global Filter—See
- Guest Filter—See
- Recommendation Filter—See
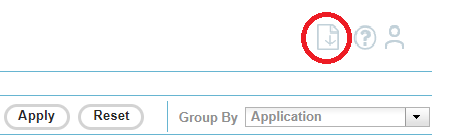
- Click the Export to Excel (
 ) icon located at the top-right of the toolbar. This button is disabled when there is no data to export or if export is not supported for the dashboard/page. Tabular data is exported to an Excel spreadsheet. Charts and graphs are not currently exported.
 - You can see the progress of the export in the lower left corner of your browser window. Save the Excel spreadsheet file with a new name.
The export file is appropriately named and is saved to the download folder defined by your browser. The file includes all pages of the report. The first row of the spreadsheet includes the name of the dashboard or page, the date and time of the export and the name of the user who exported the data.
The .CSV file is a data dump without any formatting. You can open the exported file in Excel, and format or modify the data as required.
When you are exporting filtered lists, only the systems that match the filtering criteria are exported to the Excel file. When working with the guest filter and dynamic attributes, you may want to refresh the list before exporting it. See Using the Guest Filter
Exporting from the Instance Optimization Details Pages
Due to the volume of data being aggregated and formatted, when exporting data from the Instance Optimization Details page, you may see the following message:
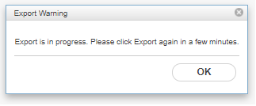
This message indicates that the report is being built in the background. To view the report:
- Click OK to close the warning message.
- Allow a few minutes for the report generation to complete. This will take, on average 3-5 min or up to 10 min, depending on the number of records in the report. You can navigate away from this page and return to view the export progress.
- Click the Export icon again, while your session is still active, to view the generated report.
Cluster Breakdown and Namespace Breakdown Tabs
You can export the content from the Cluster Breakdown, Namespace Breakdown tabs to see the full set of data. Data can be export to XLSX format.
Click the Export to Excel () icon to export the tabular data.
Data Tab
When viewing the Data tab, you can configure the tabular data using the filters, grouping options and data controls and then export the data to a .CSV file.
Click the download to .CSV icon ( ) to export the content of the currently displayed table to .CSV format.
Details Tab
When you are viewing the Details report, the displayed set of container data will be exported from this tab. The data has already been filtered, depending on how you arrived at the Details tab.
Click the download to .CSV icon () to export the content of the currently displayed table to .CSV format.
When exported to .CSV the total of "Net Savings
($/month)" column may not match the value in the exported file because the .CSV format does not support formulas.