Nodes Tab
Nodes Tab
#380950
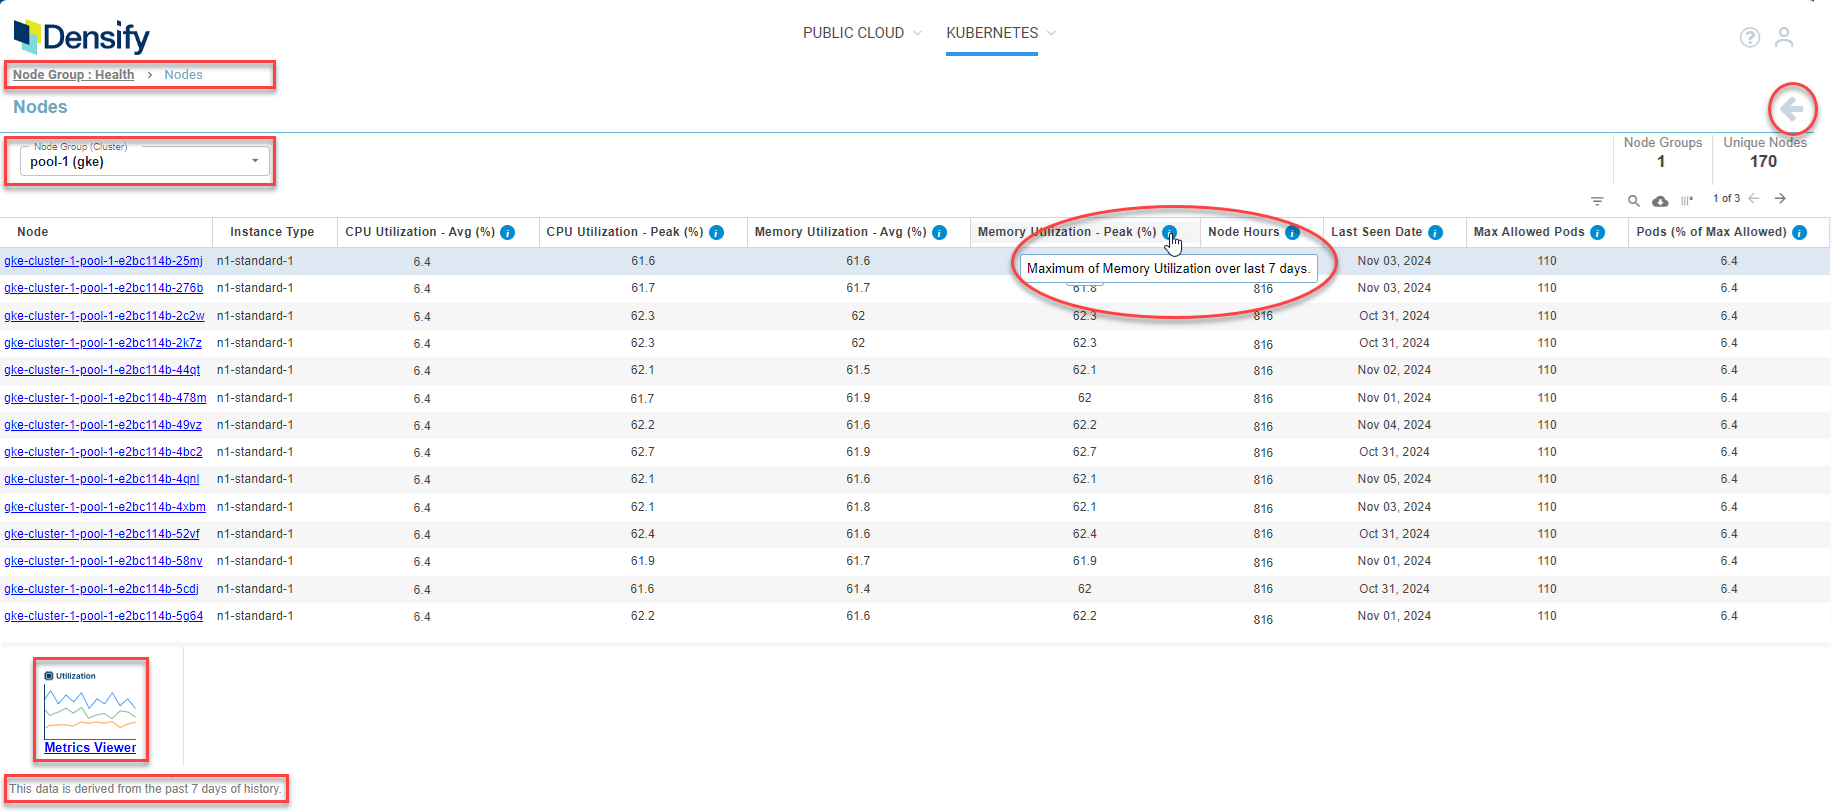
The Nodes report provides utilization details of the nodes in a selected node group. You can see key metrics including both peak and average utilization for both CPU and memory. These metrics highlight container performance and stability issues. More significantly, you can now see the pods as a percentage of the maximum allowed on a node and identify where nodes are unable to host more pods, due to the maximum CPU and /or memory value being too low. i.e. a virtual constraint.
Page Navigation
Use the breadcrumbs in the upper left corner or click the Back button, in the top-right corner of the page, to return to the parent dashboard. Do not use the browser's Back button for navigation within Densify. You will be logged out of your session. See
Selection Bar
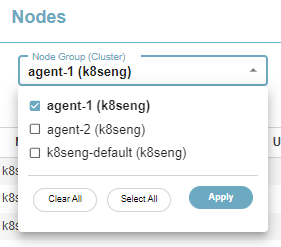
A selection bar located at the top of the page allows you to select other nodes or node groups. Once selected, the node details are displayed on this page.
Summary totals are displayed in the upper right corner of the page. These totals are for the nodes displayed on the current page and not all of your container environments.
Note: This summary bar will not be updated based on the criteria in the table filter. See Using the Table Filter for details on using the filter table.
The controls, in the upper right corner of the page, provide options for managing and viewing your data more effectively. See Data Controls on Tabular Reports for more details.
Viewing the Tabular Data
The tabular report provides the following details:
|
Column |
Description |
|---|---|
|
Cluster |
The cluster name containing the selected node group/nodes. This column is hidden by default. You can enable it for display, as required. See Data Controls, above. |
|
Node Group |
The name of the node group that contains the selected node. For nodes that do not belong to a node group, the node group value should be <cluster-name>-default” This column is hidden by default. You can enable it for display, as required. See Data Controls, above. |
|
Node |
The node name. This name is a hyperlink that opens the metrics viewer |
|
Instance Type |
The node's instance type. In cases where the instance type cannot be determined (i.e. bare-metal, private cloud environments) the primary node type is indicated as: CPU x memory size, eg. 8x16. A dash (-) indicates that the no node instance details could not be determined. |
|
CPU Utilization - Avg (%) |
The average CPU utilization for this node, during the past 7 days of history. The cell will be shaded when the value exceeds 90%. |
|
CPU Utilization - Peak (%) |
The maximum CPU utilization for this node, during the past 7 days of history. The cell will be shaded when the value exceeds 90%. |
|
Memory Utilization - Avg (%) |
The average memory utilization for this node, during the past 7 days of history. The cell will be shaded when the value exceeds 90%. |
|
Memory Utilization - Peak (%) |
The maximum memory utilization for this node, during the past 7 days of history. The cell will be shaded when the value exceeds 90%. |
|
Node Hours |
The total number of hours that this node has been up and running, based on CPU utilization, during the past 7 days of history. |
|
Age (days) |
The number of days since the node was first discovered by Densify. This column is hidden by default. You can enable it for display, as required. See Data Controls, above. |
|
First Seen Date |
The date, on which this instance was first discovered by Densify. This column is hidden by default. You can enable it for display, as required. See Data Controls, above. |
|
Last Seen Date |
The date, on which this instance last had CPU utilization data collected by Densify. |
|
Max Allowed Pods |
The optimal configuration for the maximum number of pods allowed on this node. |
|
No. of Pods - Avg |
The average number of pods running on this node over the last 7 days. This column is hidden by default. You can enable it for display, as required. See Data Controls, above. |
|
No. of Pods - Peak |
The maximum number of pods running on this node over the last 7 days. This column is hidden by default. You can enable it for display, as required. See Data Controls, above. |
|
Pods (% of Max Allowed) |
The ratio of the maximum number of pods that were run versus the maximum that the node could support, in the last 7 days. Calculated as the (peak number of pods)/(maximum allowed pods). The cell will be shaded when the value exceeds 90%. |
|
Node CPU |
The total number of CPUs on this instance type. This column is hidden by default. You can enable it for display, as required. See Data Controls, above. |
|
Node CPU Allocatable |
The number of CPUs that can be allocated to pods. This column is hidden by default. You can enable it for display, as required. See Data Controls, above. |
|
Node Memory (GB) |
The total amount of memory on this instance type. This column is hidden by default. You can enable it for display, as required. See Data Controls, above. |
|
Node Memory Allocatable |
The amount of memory that can be allocated to pods. This column is hidden by default. You can enable it for display, as required. See Data Controls, above. |
Please observe the following for this set of data:
- Missing data is indicated with a dash (-);
- A footnote indicates that the data is derived from the past 7 days of history.
- What happens to nodes that are not part of a node group?
- What happens when a node is reporting it is associated with a node_group most of the hours of the day except for a few hours when it is not.