Using the Metrics Viewer
Using the Metrics Viewer
#380890
The Densify metrics viewer allows you to view your collected and analyzed time series data to review specific instance details. You can use the metrics viewer to investigate details when deciding whether to action specific recommendations.
The metrics viewer is not currently supported for VM Scale Sets. See Table: Feature Support for VM Scale Set for details.
If you want to view the metrics for your containers and node groups see Using the Metrics Viewer for Containers.
Page Navigation
Access the metrics viewer from the Instance Optimization Details page for both cloud instances and AWS ASGs.
Use the breadcrumbs in the upper left corner or click the Back button, in the top-right corner of the page, to return to the parent dashboard. Do not use the browser's Back button for navigation within Densify. You will be logged out of your session. See
Clicking the hyperlink opens the metrics viewer showing the selected instance. The page opens with either the default or saved filter settings, if you are within the same session.
Metrics Viewer Controls
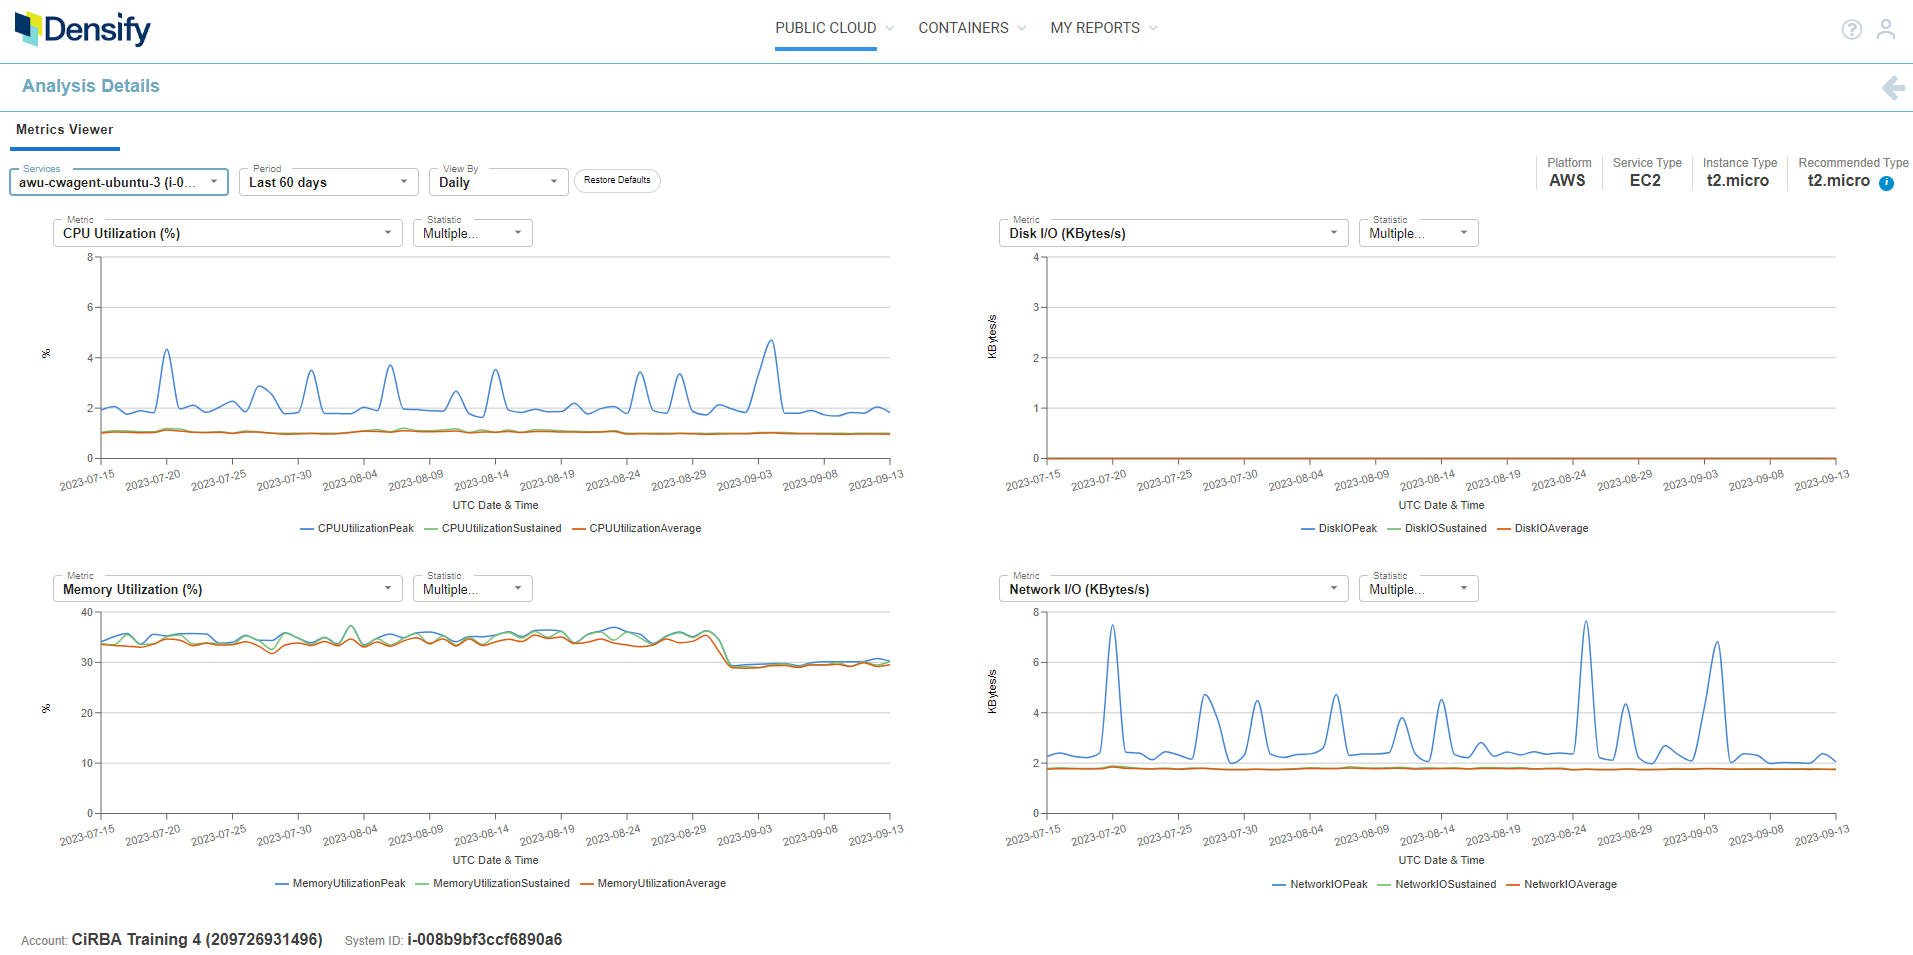
When you open the metrics viewer, the instance that was selected in the Instance Optimization Details page is displayed. You can now configure the data you want to view for this instance using the options in the dropdown controls. You can also select another service.
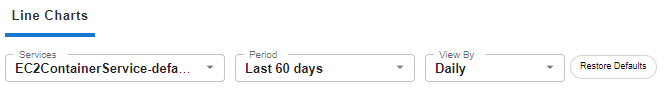
There are 3 options to configure this report:
|
Setting |
Default |
Description |
|---|---|---|
|
Services |
Last selected instance from the Instance Optimization Details |
This dropdown list is populated with the instances from the Instance Optimization Details page from where the metrics viewer was opened. i.e. all of the services displayed in the tabular report in the upper pane, are available here. Services in this list are named using the convention <service name><system-id>. The selected instance is at the top of the list and the rest are listed in alphabetical order. You can select one service to review. To search for a specific instance enter the name of the instance, as you type, matching strings are displayed in the list. You can also paste a string into this field and if a match exists, it is displayed. Only the services from the parent Instance Optimization Details page are searched. |
|
Period |
Last 30 Days |
Select the period on which you want to report. There are 4 pre-defined options as well as the option to customize a date range. Select "Other" and enter your start and end dates in the calendar. Click Apply to close the calendar and update the charts with the new period. Note: Densify retains up to 3 months of historical data for the metrics viewer. When creating a customized period, you cannot view data older than 90 days. If a recommendation has been implemented that results in an instance type change during the selected period, you may observe data missing from the charts. See Relearning Workload Patterns. |
|
View By |
Daily |
Select the unit of time to use for displaying the data. You can select hourly or daily. The option to display hourly data is only available when the date range is less than 7-days. When reporting on more than 7-days, only the daily option is available. |
|
|
|
Click this button to reset all of the settings to their default values. You will be prompted and then the menu options are reset and the charts are refreshed accordingly using the default values. |

All of the charts, are refreshed immediately when you change any of the control options. Your settings are saved for the current user session and are returned to the default values if you log out or if another user opens the metrics viewer.
Relearning Workload
If a recommendation has been implemented that results in an instance type change during the selected period, you may observe data missing from the charts. See Relearning Workload Patterns.
Details of the selected instance are displayed in the upper right corner of the page.
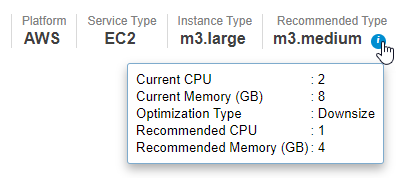
Clicking on the icon  on the Recommended Type displays the details of the recommended instance type.
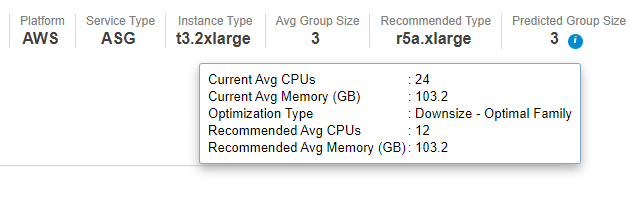
Additionally, Predicted Group Size is shown only for ASG services. The information icon on this field displays the details of the recommended instance type. The details for the Predicted Group Size are calculated as follows:
- Current Avg CPUs or Memory = CPUs or Memory of the current instance type * Current Avg Group Size
- Recommended Avg CPUs or Memory = CPUs or Memory of the recommended instance type * Predicted Group Size
Configuring the Individual Charts
You can configure each of the 4 charts separately using the 2 dropdown controls above each chart. The options are slightly different for an ASG.
|
Setting |
Default |
Description |
|---|---|---|
|
Metrics |
|
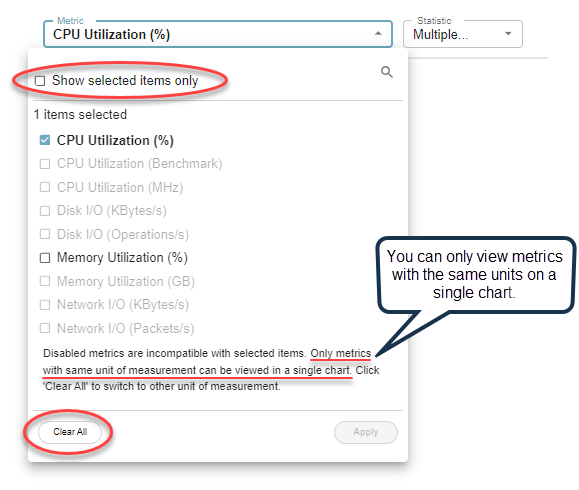
This dropdown list is populated with metrics that can be added to the selected chart. Select or remove any metrics to be added or removed from the chart and click Apply to update the chart. See below for the list of available metrics. Metrics that are not compatible with the selected items are disabled (greyed out). Only metrics with the same units can be viewed in a single chart. Click Clear All to clear the current selections and enable all metrics. You can now select other metrics with the same units. This also clears the Show selected items only box. Use the search feature to find a specific metric. Check the Show selected items only box to hide the list of other metrics. If this option is enabled and you use the search feature, only items that are shown in this list are searched. Disable this box to search all metrics. Note: Network I/O Packets is not collected for RDS services. Consequently, if you select Network I/O Packets for RDS, the resulting chart will always display "No data available". |
|
ASG Metrics |
|
|
|
Statistic |
|
Select the workload scoring strategies to be plotted on the chart. Peak, Sustained and Average are selected by default. Minimum is the other available option. For ASGs, when "No of In Service Instance", is selected, then Peak, Average and Minimum are selected by default. See Quartiles in the Resource Utilization Charts for details of how peak, sustained, etc are determined. A legend below each chart shows the line colour that corresponds to the statistic. |
The line chart shows the selected metric plotted by the hour or date.
The X-axis scales based on the amount of data up to the maximum of 6 months. The X-axis will show both date and hour when the date range includes less than 7-days. Only the date is shown when there are more than 7-days of data on the chart.
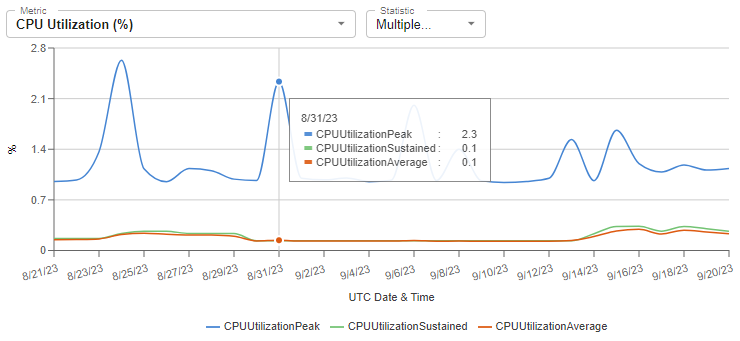
If you hover over any data point in the graph a popup indicates the values on the selected date. You can slide the mouse along the plotted lines to see data values at the specific dates or time.
If metric data is not available, the message NA: <Metric><Statistic> is shown in the legend of the impacted chart.
A footnote at the bottom of the page lists the following details:
|
ASGs |
All Other Services |
|---|---|
|
|
Additional Considerations
- Settings are saved/cached separately for each type of services (EC2, RDS, Azure, GCP, etc.)
- When converting the Bytes to MBytes for Disk I/O and Network I/O, values will be divided by 1,000,000. When converting the MB to GB for Memory utilization, the value will be divided by 1,024.
- If the selected instance has been recently optimized. (i.e. changed instance type), then any historical data that was collected before the instance type was changed is not displayed. A footnote indicating the change is displayed, under the legend: "Instance Type Updated On: MMM-DD-YYYY"
- Possible data inconsistency issues may result from the following situations:
- The value of "instance type updated on" information is from the system attributes table which is only refreshed by the weekly RDB populate, so there may be a discrepancy or data inconsistency if the instance type was changed 2 days ago and the RDB was refreshed 5 days ago.
- In this release, Densify will show the last time that the instance type was changed. If the instance type has changed 3 times during the selected period, the footnote will show the date on which the instance type was last changed.
The following tables list the complete set of metrics that you can review in the metrics viewer.
|
Metrics |
Units |
|---|---|
|
CPU Utilization |
% |
|
CPU Utilization |
Benchmark |
|
CPU Utilization |
MHz |
|
CPU Max Utilization |
% |
|
Disk I/O |
Kbytes/s |
|
Disk I/O |
Operations/s |
|
Memory Utilization |
% |
|
Memory Utilization |
GB |
|
Network I/O |
Kbytes/s |
|
Network I/O |
Packets/s |
|
Metrics |
Units |
|---|---|
|
Auto Scaling - Max. Size (No. of Instance) |
|
|
Auto Scaling - Min. Size |
No. of Instance |
|
Auto Scaling - Tot Instances |
No. of Instance |
|
CPU Allocation |
Benchmark |
|
CPU Utilization |
Benchmark |
|
CPU Utilization |
% |
|
CPU Utilization |
MHz |
|
Disk I/O |
Kbytes/s |
|
Disk I/O |
Operations/s |
|
Memory Utilization |
% |
|
Memory Utilization |
GB |
|
Network I/O |
Kbytes/s |
|
Network I/O |
Packets/s |
|
No of In Service Instances |
No. of Instance |
|
Metrics |
Units |
|---|---|
|
GPU Utilization |
% |
|
GPU Memory Utilization |
% |
|
GPU Memory Utilization |
MB |