Creating Custom Reports
Creating Custom Reports
#380210
Densify provides a wide selection of reports that cover many aspects of managing both on-premise and cloud-hosted environments, but you may still need reports that suit your specific business requirements. Densify provides the ability to create custom reports through the Densify Business Intelligence report designer, which leverages the JasperReports Server (Jaspersoft's embedded BI reporting platform).
The integrated Densify Business Intelligence allows you to generate reports in Densify from dashboards created in JasperReports Server. Once the reports have been created and published, they are displayed in the My Reports menu for all Densify users.
Your custom report content is populated with current data in Densify, which includes your collected and analyzed infrastructure configuration and utilization data. Report content is updated after data collection and analysis occurs in Densify.
Prerequisites
In order to access Densify Business Intelligence's Configure My Reports page, you need the following:
- The Densify Business Intelligence report designer feature needs to be enabled for your Densify server. Contact [email protected] for details on licensing and enabling this feature.
- Report Designer Group membership—your user account, must belong to the "Report Designers" user group. Only users in the report designer group can view the Configure My Reports menu item and access the integrated JasperReports Server console. Once reports have been created and published, all Densify users can view the reports through the My Reports menu.
Note: Only one user with report designer privileges can access the Configure My Reports option at a time.
Creating Reports
Creating custom user reports involve the following workflow:
- Create a custom report from an existing dashboard. Refer to Creating Custom Reports for detailed process steps.
- If an appropriate dashboard does not exist for your custom report, create a dashboard from the integrated JasperReports Server console. Refer to Creating Dashboards for detailed process steps.
- After creating your custom report, you must publish it before Densify users can view the report. See Publishing Reports.
- To review your newly created custom report, see Viewing My Reports.
- If you need to modify your custom report, refer to Modifying Reports.
As part of Densify Business Intelligence, a set of public domains are provided from which you can create your own dashboards and ad hoc views in the JasperReports Server console. The created dashboards are integrated into Densify from where you can generate custom reports.
In this section you will create an ad hoc view based on a Densify public domain; then use the ad hoc view to generate the dashboard required for your custom report. See Densify Public Domains for a list of public domains available in Densify.
Note: When creating dashboards and views, you must be familiar with Jasper reporting concepts and structures, as well as using the JasperReports Server console. Refer to Jaspersoft's JasperReports Server online documentation.
- Log into Densify using a user account that belongs to the "Report Designer" group.
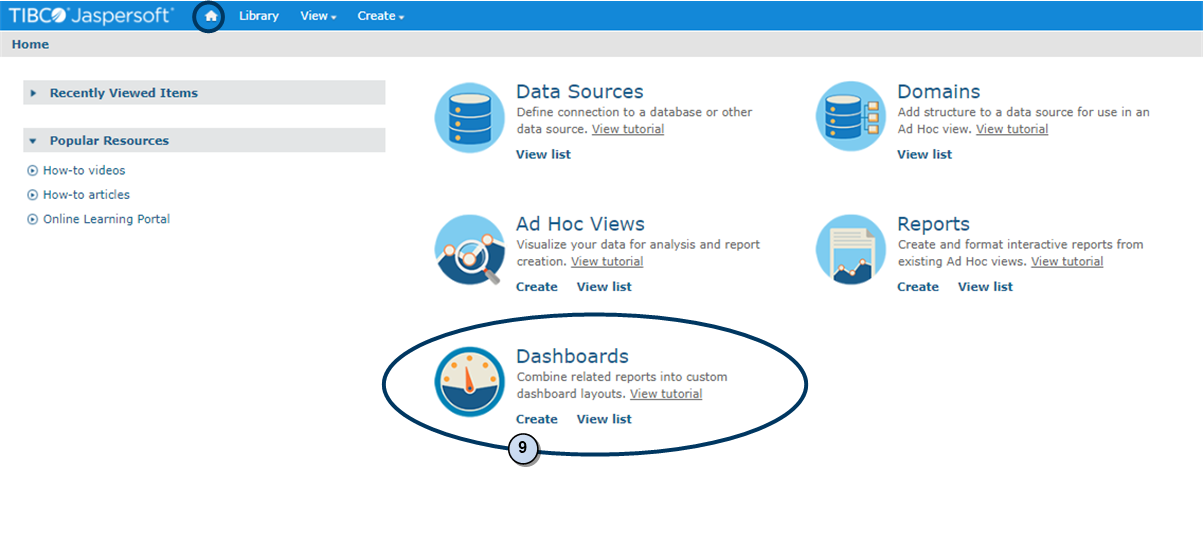
- Click the My Reports > Configure My Reports option.
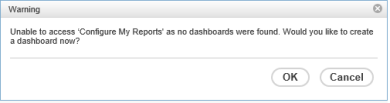
- If there are no dashboards in Densify, the Configure My Reports page is not available and you will see the following message that prompts you to create a dashboard. Click OK to be directed to the JasperReports Server console.
- If the Configure My Reports page is displayed, but does not have an appropriate dashboard for your custom report, click Create Dashboard(s) to open the JasperReports Server console.
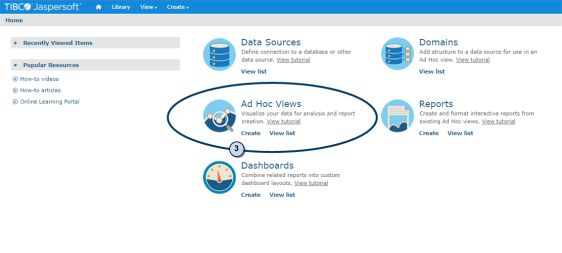
- In the JasperReports Server console, select Ad Hoc Views > Create. Alternately, click the toolbar Create > Ad Hoc Views.
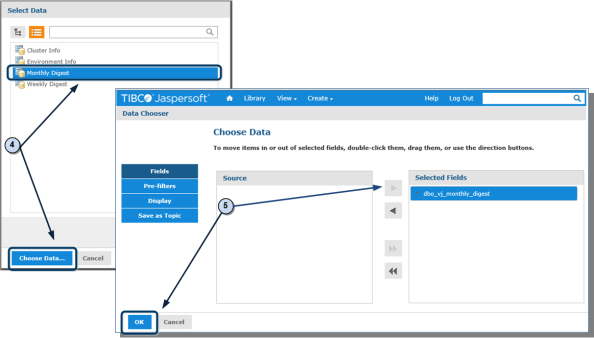
- Select a domain from the list of domains provided. Click the Choose Data button.
- In the Choose Data window, select one or more views from the Source list and add them to Selected Fields list. Click OK.
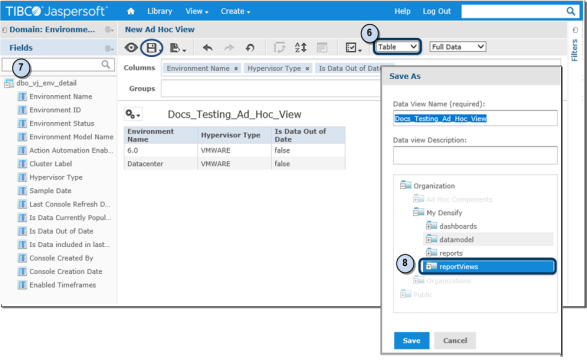
- Select the type of view you want to create: table, chart, or crosstab. Refer to the JasperReports Server online help for details on the view types and the data required for each view type.
- In the New Ad Hoc View window, expand the view and drag the columns to be included in your new ad hoc view to the Columns or Row bar. Alternatively, you can drag the whole view to the Columns or Row bar and then delete the columns you do not need.
- Click the Save icon to save the ad hoc view into the "/Organization/My Densify/reportViews" folder.
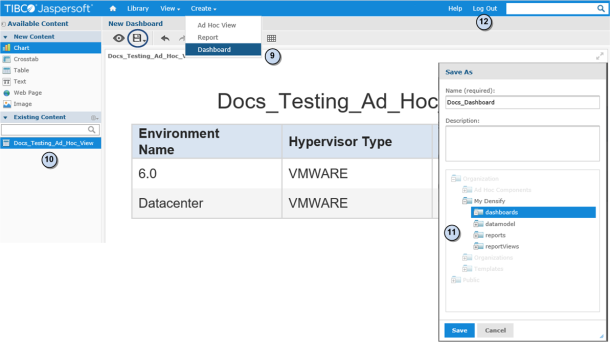
- On the JasperReports Server home page select Dashboards > Create. Alternately, click the toolbar Create > Dashboard.
- Drag your ad hoc view onto the New Dashboard design page. Add any other items to customize your dashboard.
- Click the Save icon to save the dashboard into the "/Organization/My Densify/dashboards" folder. When saving the dashboard, you only have access to the "/Organization/My Densify" folder on the JasperReports Server file system.
- Log out of the JasperReports Server console.
- Log back into the Densify Console to view the new dashboard in the Configure My Reports page.
When you get directed to the JasperReports Server console, you are automatically logged out of your Densify Console session, any unsaved work will be lost.
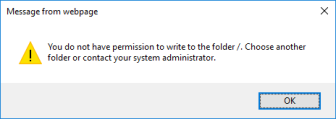
When saving the ad hoc view, you only have access to the "/Organization/My Densify" folder in the JasperReports Server file repository. If you see an error message indicating that you do not have access, expand the "Organization" folder and you will see "My Densify".
Note: You must save your dashboards in the "/Organization/My Densify/dashboards" folder in order to access the dashboards from the Densify Console.
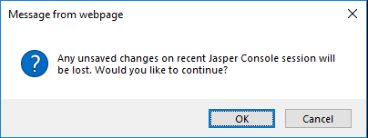
A message prompting you to save your changes in the JasperReports Server console, as your changes will be lost once you log into Densify. If you have saved your view and dashboard, it is safe to click OK and continue to the Densify Console.
Once a JasperReports Server dashboard has been created in the "/My Densify/dashboards" folder, the Configure My Reports page in your Densify interface is accessible.
- Log into your Densify Console and navigate to My Reports > Configure My Reports.
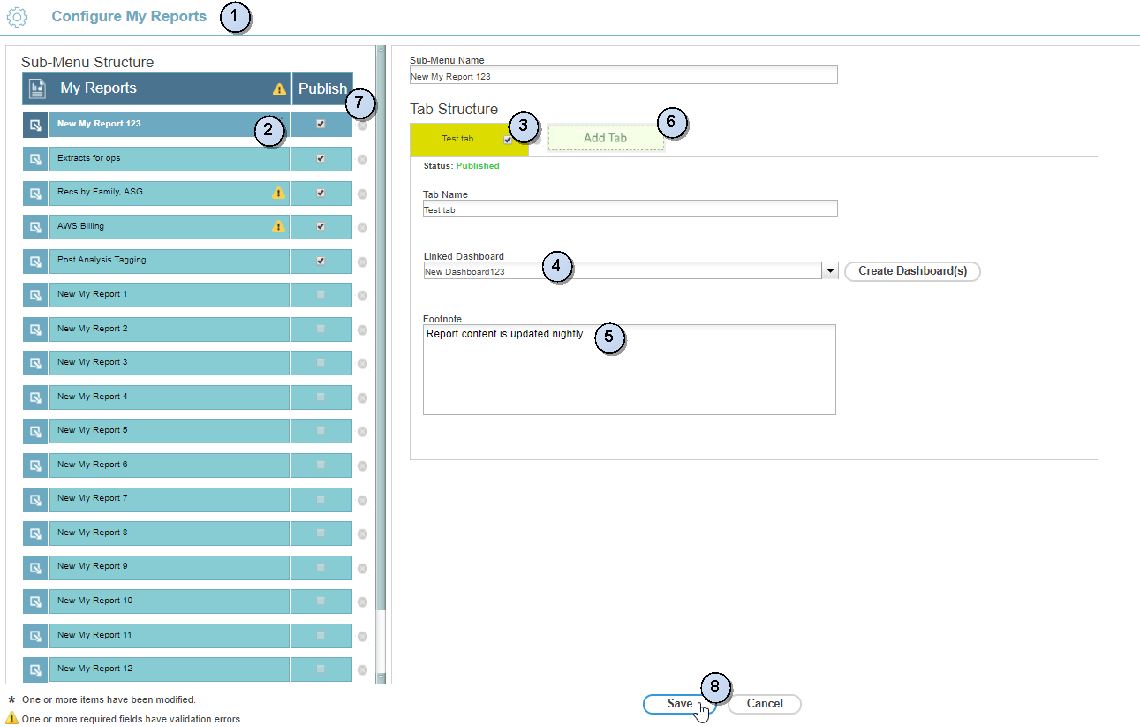
- Select an empty New My Report # report tab from the Sub-Menu Structure. Enter a name for your report in the Sub-Menu Name field. This name is then displayed on the selected report tab in the Sub-Menu Structure.
- Select New Tab 1 and enter a name for the tab in the Tab Name field.
- Select a linked dashboard for the tab in your new report. This dropdown list contains dashboards available in the integrated JasperReports Server repository.
- Enter any specific information related to the report content in the Footnote field. Limit your footnote entry to 1000 characters.
- Click Add Tab to add additional tabs to your report. Specify the tab name, linked dashboard and footnote for each new tab.
- Check the Publish boxes for any new reports or report tabs. An asterisk (*) indicates that the report has been modified and not saved. Click Save to save all changes and publish the selected items. You are not able to publish a report until:
- the report name is entered;
- a dashboard is selected for at least one published tab;
- the tab name is entered for the published tab.
- The saved and published report now appears under the My Reports menu and contains current reporting data.
You can create up to 20 reports and display these reports under the My Reports menu.
You can create new dashboards within the integrated JasperReports Server. Save any changes on the current page and then click Create Dashboard(s). You are re-directed to the JasperReports Server console. Any unsaved changes made on the Configure My Reports page will be lost and you will be logged out of the Densify Console. Refer to Creating Dashboards for details.
Note: Once a dashboard is referenced by a report, do not delete it from the JasperReports Server repository. Tabs highlighted in red indicate that the linked dashboard cannot be found in the JasperReports Server repository.
You can drag the tabs to re-order them. The order displayed here is the order in which the tabs are displayed in the published report.
Select up to 5 tabs for your report.
Report validation errors are indicated with a caution icon ( ).
).
|
Column |
Description |
|---|---|
|
Save |
Save the current settings and create/update the report. Any changes you have made are validated and any conflicts/warnings need to be resolved before your changes can be saved. Warning messages are displayed for duplicate report, tab names, blank names, character count exceeded, etc. Validation warning messages indicate the actions required before you can save the report. |
|
Cancel |
Click this button to ignore any changes and return to the previously saved page. The Cancel button is not enabled until there are changes made on the page. |
|
Publish Check boxes |
These check boxes are displayed by each report element that can be published. Check the box to indicate you want to publish the report or tab. You can un-publish a report by de-selecting the checkbox. When you click Save, the report or tab is removed from the My Reports menu. The report or tab is not deleted it is just not visible to all users. See Publishing Reports for details. |
|
Create Dashboard(s) |
Click this button to navigate to the integrated JasperReports Server. You are logged out of your current Densify session and re-directed to the JasperReports Server console. See Creating Dashboards for details. Once your dashboard is complete, you must log out of the JasperReports Server and then log into Densify to access your dashboard through the Configure My Reports option. |
|
Delete |
Click the Delete button ( When you save your changes, you will be prompted to confirm the deletion of the report or tab. These changes are immediately updated to reports that have been published to the My Reports menu. |
Once the report is published, it becomes available under the My Reports menu. All users are able to select and view this report. When publishing your report, observe the following:
- The order of the reports in the My Reports menu is the same order as Configure My Reports > Sub-Menu Structure. You can drag and drop the Sub-Menu Structure reports to obtain the desired order.
- The order of the tabs in your custom reports is the same as the order as Configure My Reports > Tab Structure. Again, you can drag and drop the tabs to change their order.
- The Sub-Menu Name is used as the page title.
You can un-publish or delete any report or tab, as required from the Configure My Reports page. Once you click Save, these changes are reflected in the My Reports section.
You may need to modify an existing custom report to meet updated requirements. As you modify your custom report, an asterisk(*) is displayed next to the item on the report to indicate the following changes:
- changes to any labels/reports/published option on the tabs;
- changes to the report labels in the sub-menu section;
- tabs are re-ordered within the tab structure when a specific report is selected;
- reports are re-ordered within the sub-reports under the sub-menu structure.
If you are editing a report, select the report from the sub-menu. Update the fields as required and click Save. The updated custom report is immediately visible to Densify users after refreshing the browser page.
A domain is a metadata layer that provides a business view of the Densify analysis data accessed from the Densify reporting database. These virtual views are created and stored in the report server without modifying the data source. Through a domain, you can see columns that have been joined, filtered, and labeled for your business requirements. You can implement security policies to limit the data values that a user can access. Densify public domains are the published domains, available to Densify users with report designer privileges, for the purpose of creating customized reports.
The following public domains are provided with Densify:
- Environment_Info
- Cluster_Info
These domain names do not contain spaces to facilitate integration with the Densify Business Intelligence API.
For a description of the elements available in the Densify public domains, refer to
If you need to extend the Densify public domains for your business requirements, contact [email protected] for details on additional Densify reporting services.
Once a report has been published all users can access and view it from the My Reports menu. The My Reports menu is only displayed if custom reports have been created and published. When you select a report, it is displayed in the main pane. The order of the reports in the menu is the same as that on the Configure My Reports > Sub-Menu Structure list.
The content of the custom reports are updated, like the standard Densify reports, after each data collection and analysis refresh.
Note: The global, guest and recommendation filters are not available for these reports.
The License Compliance report is provided under My Reports. See