Control Console Spectrum Overview
Control Console Spectrum Overview
#230340
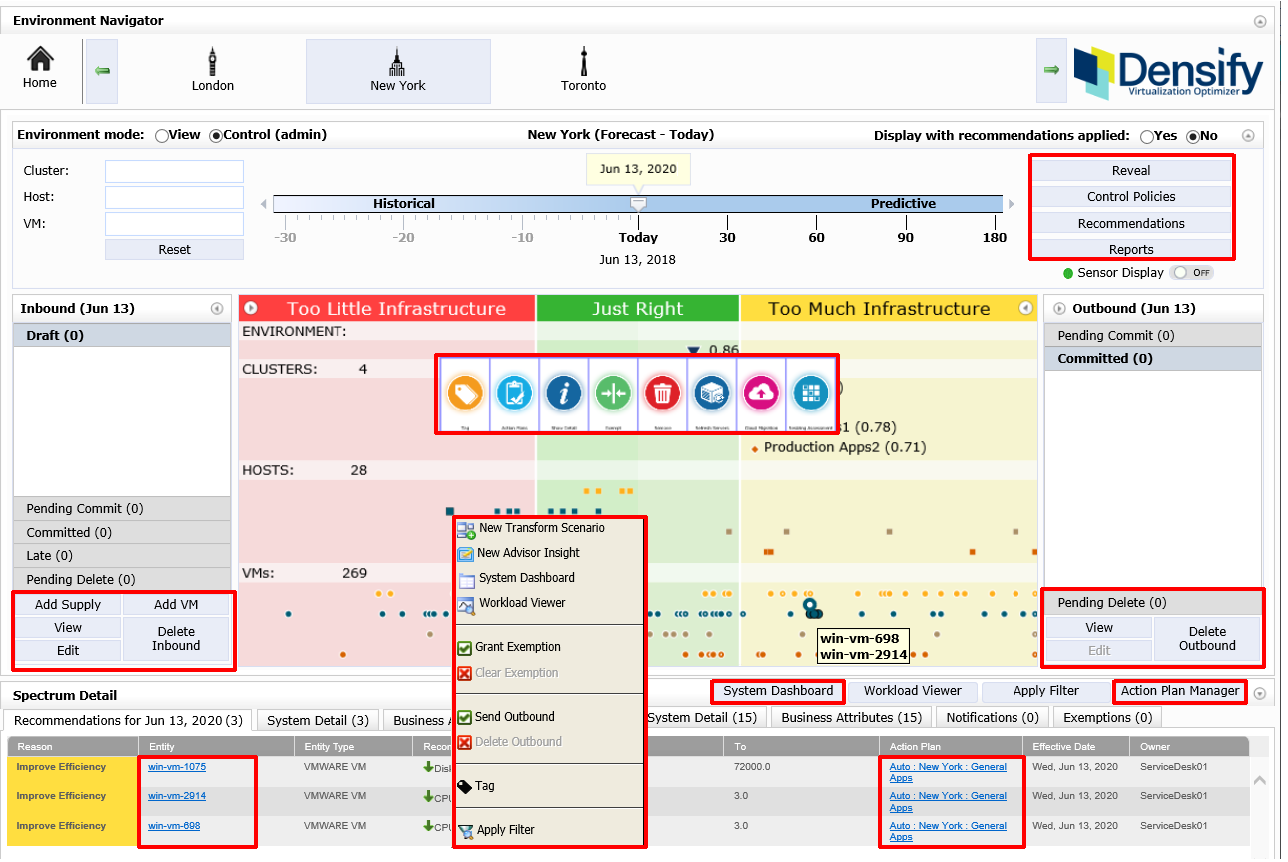
The Spectrum enables you to quickly assess where risks exist and where there is excess capacity, according to policy. VMs, hosts, infrastructure groups and sensors that are in the red ("Too Little Infrastructure" band) are under-provisioned and at risk. VMs, hosts, infrastructure groups and sensors that are in the yellow ("Too Much Infrastructure" band) have excess capacity that may be reclaimed. This visualization provides a means to understand where action needs to be taken to move all entities into the green ("Just Right" zone) to remove risk and improve efficiency. Once all entities are in the green, the environment is said to be optimized according to policy.
Note: When using the Control Console in browsers other than Internet Explorer some features may not be available. Refer to the following list for details:
- Right-click context menus displayed for environments, clusters, hosts or VMs.
- The following navigation buttons in the upper right corner of the Control Console screen are not available:
- Booking Manager—Opens the Booking Manager. This button is only displayed on Control Console home page.
- Action Plan Manager—Opens the Action Plan Manager. This button is only displayed on Control Console home page.
- Control Policy tab—Opens the policy editor. This button is only displayed when an environment is selected.
- Recommendations—Opens the Recommendation Manager. This button is only displayed when an environment is selected.
- Reports—Opens all reports that were generated for the selected environment(s)
- Inbound and Outbound slide out menus—The buttons used to create, manage and delete bookings.
Also, see
Vertical Regions
The Spectrum for each environment is divided into 4 vertical regions:
- Red—VMs, hosts, infrastructure groups and sensors that are in the red are under-provisioned and are at risk.
- Green—VMs, hosts, infrastructure groups and sensors that have just the right amount of resources.
- Yellow—VMs, hosts, infrastructure groups and sensors that are in the yellow have excess capacity that may be reclaimed.
Horizontal Regions
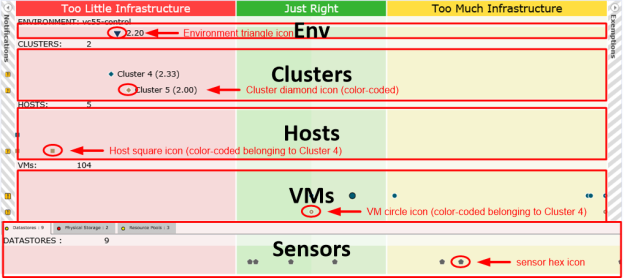
The Spectrum for an environment is divided into 5 horizontal areas:
- Environment—top level summary efficiency index for the environment;
- Clusters (
 )—efficiency index visualization for virtual clusters;
 - Hosts (
 )—host systems (e.g. ESX/ESXi servers) in the environment;
 - VMs (
 )—VMs in the environment;
 - Sensors (
 )—non-compute (non host-centric) metrics, such as datastores.
Hosts and VMs are color-coded to match their parent infrastructure group. Sensors are dark gray.
Sensor Area
The sensor area is displayed if there is sensor data available, such as datastores. See Working with Sensors for more information on sensors.
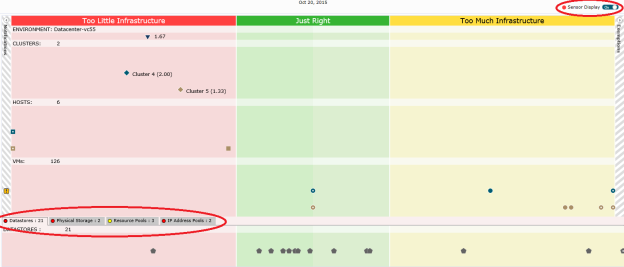
When the sensor area is displayed, click on the appropriate tab named <Sensor Type> to view the data of that type. Only a single row of icons is displayed, as sensors are shared in the environment.
The green, yellow or red icon on the tab indicates the health of the sensors shown through that tab for the specified timeframe:
- green—when all sensors are in the green (Just Right section),
- red—when at least 1 sensor is in the red (Too Little Infrastructure section),
- yellow—when at least 1 sensor is in the yellow (Too Much Infrastructure section) and no sensors are in the red (Too Little Infrastructure section).
Right-Click Features
When you right-click on any entity (including any corresponding notification or system that has been exempt), you can see a number of available options. The displayed options depend on the type of entity selected and your access permissions, with the exception of a Missing Benchmark notifications as detailed below.
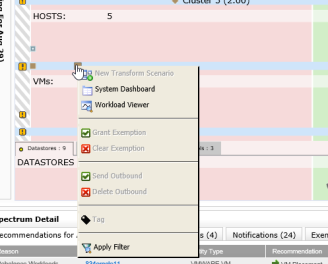
Table: Spectrum Right-click Behavior
|
Icon |
Option |
Description |
|---|---|---|
|
Infrastructure Groups ( |
||
|
|
Apply Filter |
Filters the Spectrum based on the one selected infrastructure group, host or VM. To do this, select the one system of interest and click Apply Filter. The <GroupLabel>, Host and VM filtering fields are updated with your selection. |
|
Hosts ( |
||
|
|
System Dashboard |
Opens the System Dashboard for the selected system in another browser window. |
|
|
Workload Viewer |
Opens the Workload Viewer for the selected system in another browser window. |
|
|
Apply Filter |
Same behavior as Apply Filter for infrastructure groups. |
|
Sensors ( |
||
|
There is no right-click behavior for sensors. |
||
|
Notifications |
||
|
|
Apply Filter |
Same behavior as Apply Filter for infrastructure groups. |
|
Missing Benchmarks ( |
||
|
|
Missing Benchmarks |
Displays the Benchmark Editing dialog box to resolve missing benchmarks. |


 )
)
Multiple Entity Fanout
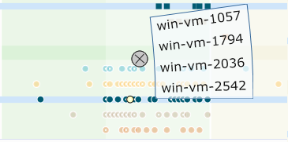
Hosts, VMs and sensors with a white dot ( ) indicate there are multiple entities at the same location of the Spectrum. In these cases, an expanded view will pop up allowing you to select the desired entity.
For example, clicking the VM icon below shows that there are actually four VM entities in that location.
You can click and drag the mouse to select a grouping of systems.
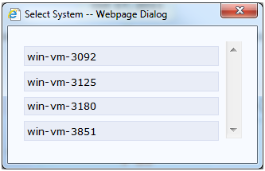
To perform a right-click operation on such an entity, right-click the entity and select the operation. Either a Select System dialog box or a dialog box with a Systems tab opens, where you can select the system on which to perform the operation.
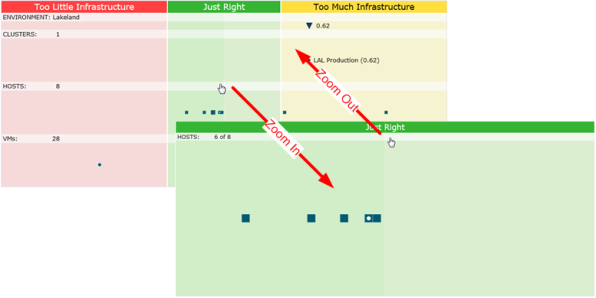
Zooming in on the Spectrum
When you are viewing an environment with many systems you will need to zoom in on regions of your spectrum to find specific hosts, VMs or sensors.
You can zoom in on any one of the three sections, Too Little Infrastructure, Just Right and Too Much Infrastructure, by clicking on the title bar. Click again to restore the default display.

You can also zoom in on any one of the four sections, Clusters, Hosts, VMs or <Sensor Type> by clicking the title bar for that horizontal area within the section of interest. Click again in the title bar area to restore the default display.
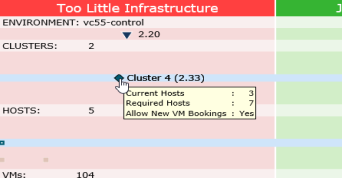
Environment and Cluster Host Summary
If you hover over an environment or cluster in the Spectrum, a popup tooltip is displayed showing the number of Current Hosts, the number of Required Hosts, the number of Hosts for HA (if applicable), and whether or not Allow New VM Bookings is permitted (displayed only for clusters).
More Details
You can drill down on any item, by clicking on it, to see more detailed information in the Spectrum Detail pane. For more details, see Spectrum Detail.