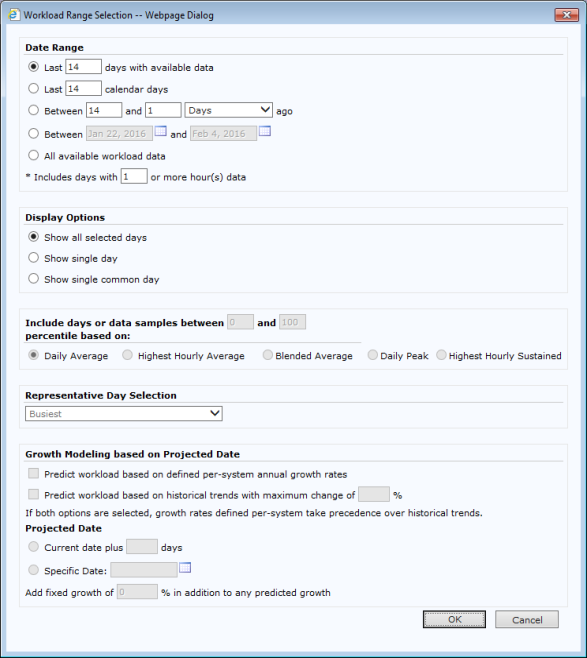
These settings allow you to view and edit workload options for the range of systems or the analysis.
|
Field
|
Description
|
|
Date Range
|
|
Last 14 days with available data
|
This is the default setting. Densify will select the worst average performance over 24 hours based on the last number of days specified. It only takes into account those days with available data. If you want to be able to view the Hourly Chart, set this value to 7 or less days.
|
|
Last 14 calendar days
|
This option is similar to the previous option, except that in this instance, you are taking into account all of the last 14 calendar days, regardless of available data for those days.
|
|
Between <#> and <#> <periodSize> ago
|
This option allows you to specify a period, regardless of available data, without setting exact dates. The period sizes are: days, weeks, months, (calendar) quarters, (calendar) years, fiscal quarters and fiscal years.
An and number of 0 means the current period.
For example, if today is Saturday 4-Sep, and weeks start on Sunday:
- between 4 and 2 weeks ago includes data from Sunday 1-Aug to Saturday 21-Aug.
- between 1 and 0 weeks ago includes data from Sunday 22-Aug to Saturday 4-Sep.
|
|
Between <start date> and <end date>
|
Densify will select the worst average performance over 24 hours based on the date range specified. Date format must be entered in dd/mm/yyyy.
|
|
All available workload data
|
[CRB-53883] This option is not available in Densify Virtualization Optimizer. If you select this option you will get an error message and the charts will not be updated.
|
|
Display Options
|
|
Display Options
|
Select the display option for the workload data.
- Show all selected days
- Show single day
- Show single common day
|
|
Include Days or Data Samples between…
|
Enter values in these fields to define what workload data to include/exclude. For example, if you input 10 and 75 in these fields, you are excluding workload data that falls below or above the specified percentile range.
This functionality is especially useful for omitting anomalies that can occur, which can lead to inaccurate results. For example, a system runs at a constant rate, but suddenly experiences a brief but significant spike in activity. If this spike is included in the analysis, this spike in activity may skew the final results of the analysis. The average value could be severely affected. It is therefore prudent to eliminate it using the percentile values.
Daily Average—If you enable this radio button, the system will calculate the average, for example, CPU utilization for each day in the range, taking into account the percentile values input in the previous fields.
Highest Hourly Average—If you enable this radio button, the system will calculate the busiest average hour for each day in the range, taking into account the percentile values entered in the previous fields.
Blended Average—Uses a combination of daily Average and Busiest hour to provide enhanced precision when specifying day preferences for your analysis. When the Blended option is selected, a 50/50 split between the busiest average hour of the day and the daily average data will be used in determining the representative day (e.g. Busiest, Typical or Least Busy).
Daily Peak—Use this option to exclude peak values e.g. when requiring data to the 95th percentile.
Highest Hourly Sustained—If you enable this radio button, the system will calculate the busiest sustained hour for each day in the range, taking into account the percentile values entered in the previous fields.
Note: If Exclude hours of day is specified, the number of required hours is only applied to the remaining hours. For example, if you exclude hours between 0-5, and the number of required hours for analysis is 10, then only the workload data with 10 or more hours that fall into the included hours of 6-23 will be used for the analysis.
|
|
Representative Day Selection
|
|
Representative Day Selection
|
Used to select a specified workload profile type (e.g. busiest, typical, etc.).
|
|
|
Enable this radio button for the representative day selection. The results are based on the days that are returned based on the above filtering criteria.
Busiest—Select this option if you are being very conservative, as this option will take into account the worst case scenario. This may not be realistic, as a momentary spike in usage will be considered. This spike does not truly reflect workload usage for a system. Therefore, you can select other options that are less conservative and will reflect a more realistic outcome.
Typical—A real day workload that is closest to the average.
Least Busy—This is the day with least activity.
Average—This is the average of the days in the selected scope/range.
Combined (days)—Select this option when only a limited sample of workload data is available e.g. one sample per hour. This option will construct a workload day by combining the filtered data samples on an hourly basis to create a more accurate representative day.
For example, if you have a single sample per hour over a many days (e.g. 30 days), Densify will calculate hourly samples based on multiple days to determine the hourly minimum, 1st quartile, median, 3rd quartile and maximum spanning the sampled days.
Combined (samples)
Combined (blended)
|
|
Growth Modeling based on Projected Date
|
|
Growth Modeling based on Projected Date
|
The growth rate is applied to the selected Representative Day. If the selected Representative Day is the actual day, the data for the projection will be used, otherwise use the middle date of the date range will be used. The annualized growth rate and the date of the data used, will be saved with the analysis.
Predict workload based on defined per-system annual growth rates—This option uses Average workload based on historical data. This is used in conjunction with the growth rate defined per workload. When selected, the analysis looks at the utilization for the selected date range and estimates growth based on trends in the number of days specified in the Current Date Plus field, below.
Adjust workload based on historical trends—This option uses Average workload based on historical data. When selected, the analysis looks at the utilization for the selected date range and estimates growth based on trends in the number of days specified in the Current Date Plus field, below. You can also specify a maximum limit for the growth.
For example, if you enter 60 days, this means that you want to predict workload usage 60 days in the future for all systems in the analysis. At the same time, you enter a maximum change value of 50%. This means that you want to limit the workload type value at 50% usage, for that date 60 days in the future.
|
|
Projected Date
|
|
Current Date Plus
|
If you have enabled the Include Days Matching option, you can input a number of days in this field, which is added to the current date.
For example, assume that today’s date is May 22, 2008 (a Thursday) and you input 1 in this field. This would give you a date of May 23, 2008 (a Friday). This means that you are telling the system to grab all of the Fridays in the range and all of the 23rd days of the month in that range.
Now, the following day (Friday 23rd), you perform a refresh and run the analysis again. This means that the system grabs all of the Saturdays in the range and all the 24th days of the month in that range, etc.
|
|
Specific Date
|
If you have enabled the Include Days Matching option, you can input a specific date in this field. For the purposes of this example, the date specified is May 22, 2008. Now, assume this date falls on a Thursday. If this date is used, then you are telling the system to go through the entire range of data specified for the analysis and to pick out every Thursday of every month, and to also pick out the 22nd of every month
|
|
Assume Zero Workload for all target-only systems
|
Enable this option to assume a zero workload for all target-only systems.
|