DCE Workload Charts
DCE Workload Charts
#171400
The content and options on the workload charts are based on your:
- Selection in the DCE (system or folder);
- Toolbar button selection,
- Selected workload type.
See DCE Workload Viewer for details on navigating to this chart.
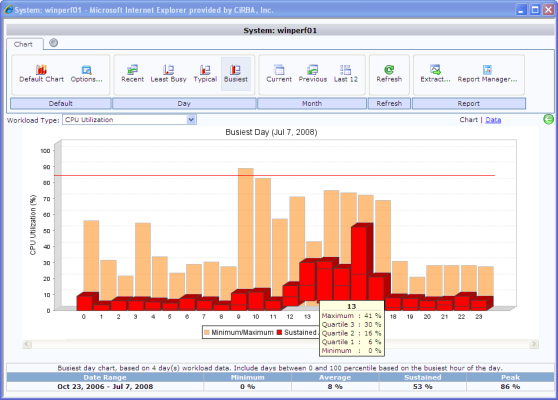
- The workload chart is displayed for the selected workload. You can view another workload by selecting it from the dropdown.
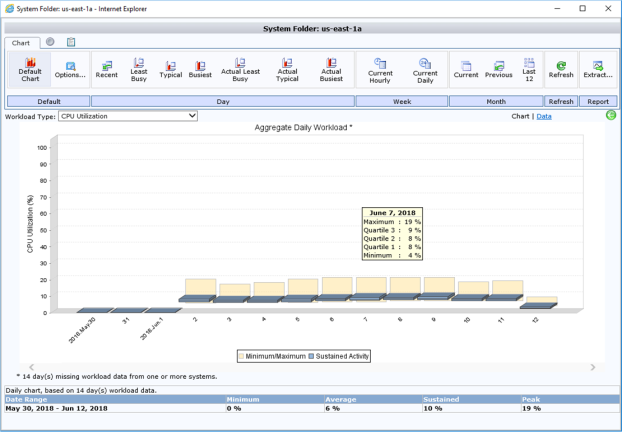
- You can hover over the columns in the chart to see quartile information about that column.
- If you see the
 icon as you hover over a column, you can drill-down on that column to reveal more information about it. For example, assume that you have created a chart, based on the last 12 months of data. You can see detailed information about a particular month by clicking the corresponding column. The chart opens accordingly.
 - When you are viewing this chart at the DCE folder level you can see the number or workload days missing from the selected scope of systems as indicated with the asterisk (*). This is not displayed at the system level.
- A table is displayed below the quartile data.
- You can switch to a tabular view of the data, for further investigation. See
- You can also extract the data to a .CSV file for use in other applications. .
- Click
 to return to the previous view.
You can drill-down until you reach the lowest level. For example, from a chart displaying the last 12 months of data, you can drill-down to the month and then to the day. This would represent the lowest level, as you cannot, in this instance, drill-down on the hours within that day.
|
Column |
Description |
|
Date Range |
Displays the audit date range. |
|
Minimum |
Displays the minimum usage value, for the selected workload type. |
|
Average |
Displays the average usage value, for the selected workload type. |
|
Sustained |
Displays the sustained usage value, for the selected workload type. Sustained represents the value that was reached 75% of the time. |
|
Peak |
Displays the peak usage value, for the selected workload type. |