Viewing the ASG Impact Analysis and Recommendation Report
Viewing the ASG Impact Analysis and Recommendation Report
#380880
As the application owner, you want to see more details of your particular cloud service, before implementing Densify's recommendations. Specifically:
- Optimization Reasoning—The data and the policy settings that resulted in the recommendation being made.
- Verification—Ensure that the recommendation aligns with your financial and organizational goals.
Recommendation are based on the latest cloud catalogs from the supported public cloud providers.
You can access this report by clicking the Analysis Report hyperlink in the lower pane of the Instance Optimization Details page to open the Impact Analysis and Recommendation Report for the selected group. See
The Impact Analysis and Recommendation report provides the following details for a selected cloud service:
- Scale Group Name and the date of the last data collection.
- Report description;
- Summary —Provides an overview of the ASG;
- Scale Group Information—Provides properties and configuration details for the selected cloud service;
- Recommendation Details—A number of sections that show workload charts and the impact of making the recommended changes;
- Effort to Optimize Auto Scaling Group—Lists the factors that contribute to the effort required to investigate and implement the recommendation;
- Cost Impact—Provides the cost benefits of implementing the recommendation.
You can scroll through the report or you can click on one of the Details tabs at the top of the page to jump to the relevant section within the report.
Creating a PDF Version of the Report
You can create a PDF version of the report by clicking the Export to PDF  button located at the top-right corner of the display.
The export file is named "SystemAnalysis.pdf" and is saved to the download folder defined by your browser. You may want to modify the filename to match the selected instance, if you are planning to review and distribute reports for multiple instances.
Summary Table
The summary table identifies the cloud service with any user defined tags, and provides an overview of any generated recommendations, predicted uptime, and policy used for the service.
Table: Summary Report Descriptions
|
Column |
Description |
|---|---|
|
Scale Group Name |
This is the system or scale group name. |
|
System ID |
A unique key assigned by the public cloud vendors to identify this instance. |
|
ECS Cluster |
This is the ECS cluster that contains the selected scale group, if applicable. This row is not displayed if there is no associated ECS cluster for the service. |
|
Public Cloud |
This is the public cloud provider (e.g. AWS). |
|
Account Name |
This is the cloud platform client account to which the service belongs. |
|
System Type |
This is the type of cloud service (e.g. EC2 instance, Auto Scaling group, Virtual Machine instance, etc.). Note: For ASGs configured with maximum group size =1, the displayed service type is "Auto Scaling Group" and not EC2. |
|
Instance Type |
This is the current, instance type. For an Auto Scaling group, this is the instance type specified in the launch configuration for the group. |
|
Instance OS |
This is the OS deployed on the service instance. |
|
ASG Recommendations |
For an Auto Scaling group these are the potential recommendations:
Any change to the average number of in-service instances, after the recommendations have been implemented, is also displayed. |
|
Uptime % |
For an ASG, this is the percentage of time that it has been up and running since the instance was started. The actual values in days and hours is also shown. If you have 24 or more days of data then you will see something like 21 days (504 hours) over a period of 26 days (624 hours). |
|
Instance Type Override (User-defined) |
This is the instance type override, and can have one of following values if the "Instance Type Override" attribute is set:
Contact [email protected] for override details. |
|
Minimum Size Override (User-defined) |
For an Auto Scaling group service, if the "Group Min Size Override" attribute is specified, then the override value is displayed.
|
|
Maximum Size Override (User-defined) |
For an Auto Scaling group service, if the "Group Max Size Override" attribute is specified, then the override value is displayed.
|
|
Policy |
This is the Densify policy that is applied to the cloud environment. The policy name and a description are provided. Contact [email protected] |
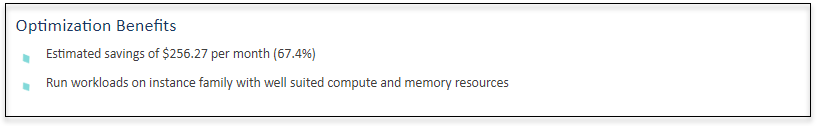
Optimization Benefits
This section of the summary lists the benefits that can be gained from implementing the recommendation. A list of bullet points maps the values of Overall Status and Optimization Types to the actual benefits to you, as the application owner, in terms of both cost and performance.
If the overall status for the selected instance is Optimal, then this section is not displayed.
If the percentage cost saving is <0.1%, then the Savings benefit is not displayed.
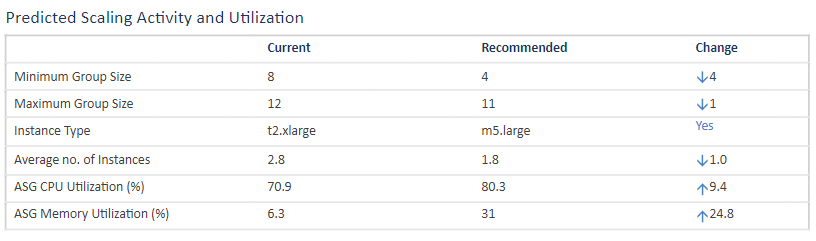
Predicted Scaling Activity and Utilization
This table provides a summary of impact to group size, instance type, CPU and memory utilization if you were to move your application to the recommended scale group configuration. The full version of this report is provided in the Recommendation Details section.
The Change column at the right, highlights differences between your current and the recommended scale group's utilization and scaling activity. This column is shown only if there are recommendations for the scale group.
The workload charts in this section show in-service instances, CPU utilization, and memory utilization (%) for the current scale group and these same metrics as they would be on the recommended scale group configuration. Additionally, both CPU Reservation% and Memory Reservation% charts for current and recommended instances are shown if the data is available.
Auto Scaling groups that have been identified as "Just Right" or "Terminate" will not have any recommendations and only the current utilization data and charts are shown.
Note: If the metrics are not available, then the corresponding chart is not displayed.
When actual memory data is not collected and memory workloads are backfilled as defined in the policy, a footnote will be added to indicate that memory utilization is based on user-defined policy settings.
For an Auto Scaling group report, the Scale Group Information table provides the following details of the selected scale group.
Table: Scale Group Properties Report
|
Column |
Description |
|---|---|
|
Scale Group Name |
This is the name of the selected scale group. |
|
ECS Cluster |
This is the ECS cluster that contains the selected scale group, if applicable. |
|
Launch Configuration | Launch Template |
This is the launch configuration or the launch template from which the scale group was created. |
|
System ID |
This is the cloud provider's unique identifier for the selected scale group. |
|
Service Type |
This is the cloud service type (e.g. AWS "Auto Scaling Group"). |
|
Account |
These are the details of the account (AWS) to which this scale group belongs. |
|
Account Name |
|
|
Instance Type |
This is the instance type configured in the scale group's launch configuration. |
|
Instance OS |
The deployed instance OS for the scale group. This information may not be always available. |
|
Department |
These are user-specified attributes that are displayed if the scale group has been tagged accordingly. |
|
Owner |
|
|
Business Unit |
|
|
Application |
|
|
Operational Environment |
|
|
Inventory Code |
|
|
Project |
|
|
Cost Center |
|
|
Product Code |
|
|
Region |
This is the region containing the selected scale group. |
|
Availability Zone |
This is the availability zone containing the selected scale group, if applicable. |
|
Creation Date |
This is the date on which the Auto Scaling group was created. |
Note: Not all utilization metrics are available for all cloud services and providers. The metrics displayed in the following tables and charts will vary depending on the selected service type.
Predicted Scaling Activity and Utilization
This table provides the impact to group size, instance type , CPU and memory utilization, as well as network IO throughput if you were to move your application to the recommended scale group configuration. The last column highlights differences between your current and the recommended scale group's utilization and scaling activity. This column is shown only if there are recommendations for the scale group.
Auto Scaling group that have been identified as "Just Right" or "Terminate" will not have any recommendations and only the current utilization data and charts are shown.
|
Scaling Activity / Metric |
Description |
|---|---|
|
Minimum Group Size |
This is the minimum number of instances for the scale group. |
|
Maximum Group Size |
This is the maximum number of instances for the scale group. |
|
Instance Type |
This is the instance type defined in the scale group's launch configuration. |
|
Average no. of Instances |
The current average instance count based on metrics collected for the scale group. The recommended average number of instances is based on current average instance count with the up or down-scaled recommendation taken into consideration. |
|
ASG CPU Utilization % |
This is the CPU utilization as percentage of the total available CPU cycles for the group. |
|
ASG Memory Utilization (%) |
This is the memory utilization as percentage of the total available memory for the group. |
|
ASG Network I/O Throughput (Bytes/s) |
This is the network throughput in Bytes/s for the scale group. |
|
ASG Network I/O Throughput (MB/s) |
This is the network throughput in MB/s for the scale group. |
|
ASG Network I/O (pkts/s) |
This is the network I/O in pkts/s for the scale group. |
|
ASG Disk I/O Operations |
This is the disk I/O in operations/s for the scale group. |
Resource Allocation (per Instance)
This table allows you to compare the allocated resources on the instance type, configured currently in your scale group launch configuration, to those allocated to the recommended instance type.
The column at the right end of the chart highlights differences between your current instance type and the recommended instance type allocations.
If there is no recommended instance type, the Recommended and Change columns are not displayed.
|
Metric |
Description |
|---|---|
|
CPU Count |
This is the CPU utilization as percentage of the total available CPU cycles. |
|
CPU Benchmark |
This is the CPU benchmark that indicates CPU performance. |
|
Memory Allocation (GB) |
This is the available memory, in GB. |
|
Max Network I/O Throughput (MB/s) |
This is the maximum network throughput in MB/s. |
|
Max Network I/O (pks/s) |
This is the maximum network IO in pks/s. |
|
Local Storage Size (GB) |
This is the disk space allocated to the instance, if applicable. |
|
Max Local Disk I/O Throughput (MB/s) |
This is the data transfer speed in megabytes per second. This information is only displayed if there is disk space allocated to the instance. |
|
Max Local Disk I/O Operations (IOPS) |
This is the rate of the I/O operations measured in 1/sec. It is a ratio of the number of operations executed by your storage device within a period of time to the duration of this period of time, in seconds. This information is only displayed if there is disk space allocated to the instance. |
Workload Charts
The following workload charts are provided so you can compare utilization on the current service against that of the recommended service configuration or instance type. The charts for the current service are shown on the left side and the charts for the recommended service are shown on the right side.
If utilization metrics are not available, the corresponding chart is not displayed.
Cloud services that are identified as "Just Right" or "Terminate" only have current utilization charts shown.
When actual memory data is not collected, and memory workloads are backfilled with the memory usage as defined by the policy, no recommended memory workload chart is displayed.
Table: Scaling Activity and Predicted Resource Utilization Charts for Auto Scale Groups
|
Current and Recommended Charts |
Current Charts |
|---|---|
|
Workload charts for both the current scale group and the recommended scale group are provided for the following metrics:
|
The following scale group workload charts only contain current metrics:
|
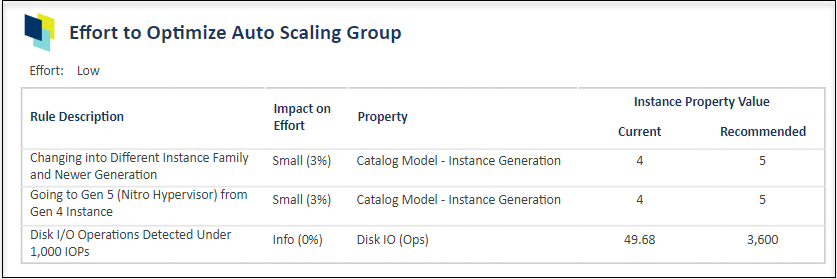
Effort to Optimize Auto Scaling Group
The table in this section lists the factors that contribute to the effort required to investigate and implement the recommendations. Effort for the selected instance is calculated by rule-driven analytics based on various factors (such as instance family change, storage change, data quality checks, feature changes, group size changes etc.) that can be configured in the policy settings and through analysis rule sets.
A description of each rule and its impact on the effort to move the current service to the recommended service type or configuration is provided.
This is the same information that is reported on the Effort Details tab in the Instance Optimization Details dashboard. See
This table is not displayed for the following conditions:
- "Just Right" optimization type—no effort is required to remain at the current service;
- "Downscale" or "Upscale" optimization type with "None" effort—for Auto Scaling groups with only sizing recommendations, no instance changing effort is required.
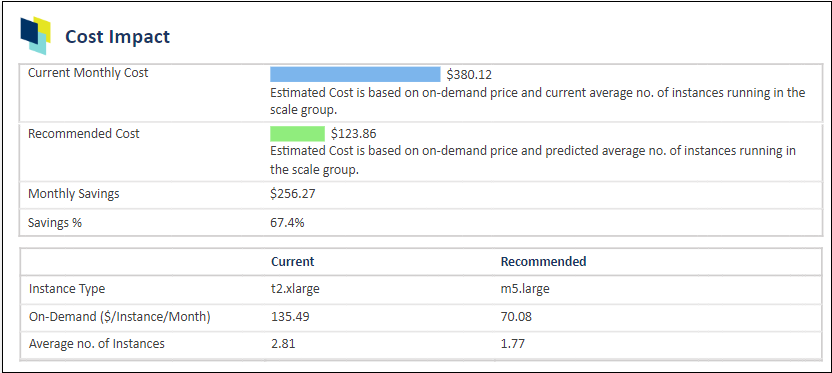
This section provides a cost summary that shows you the benefits of implementing the recommendation as well as a table that allows you to compare the cost of the current instance to the recommended instance type.
|
Item |
Description |
|---|---|
|
Current Monthly Cost |
This bar chart shows you the current and recommend instance costs and allows you compare the costs. For Auto Scaling groups, the cost is based on on-demand price and the current and predicted average number of instances running in the scale group. |
|
Recommended Cost |
|
|
Monthly Savings |
This will be your monthly savings if the recommendation is implemented. |
|
Savings % |
This will be your monthly savings, as a percentage if the recommendation is implemented. |
|
Instance Type |
This is the current, instance type. For an Auto Scaling group, this is the instance type specified in the launch configuration for the group. |
|
On-Demand ($/Instance/Month) |
This is the on-demand price, per instance, for the group's current instance type and the recommended instance type. |
|
Average no. of Instances |
This is the average number of instances running in the scale group. The recommended column contains the predicted average number of instances running based on the recommended sizing and instance type. |
Note: If the Optimization Type is "Just Right" then no Recommended Cost value is displayed.
Last Updated: June 2024
|
|
|
|
|
|
|