Data Collection for Containers
Data Collection for Containers
#410
Data Collection Status Details

|
Access this page from the side panel. The Connections icon is the last option in the Containers bar. You can monitor the status of data collection for each of your clusters, from this page. |
Figure: Data Collection Status Page
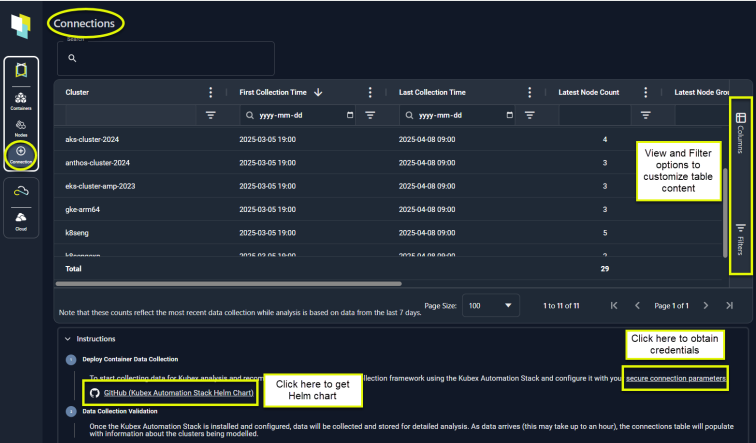
See Using Table Column Features for details on setting filters and customizing views of the table's content.
Standard Data Collection Method
Kubex collects your container configuration and utilization data and then analyzes the data to provide resizing recommendations to run your container-based applications on the correct infrastructure.
You need to deploy the Densify data forwarder to collect data from your various clusters.Densify recommends using the Kubex Automation Stack Helm Chart. This Helm chart bundles all of the components required for the data forwarder and is the preferred method of enabling data collection.
Obtaining Secure Connection Parameters
Before using the Helm chart, you need to obtain the required credentials using the link in the Connections tab:
Figure: Obtaining Secure Connection Parameters
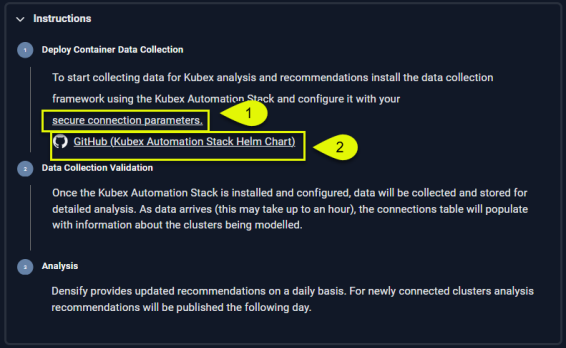
Figure: Copy Secure Connection Parameters
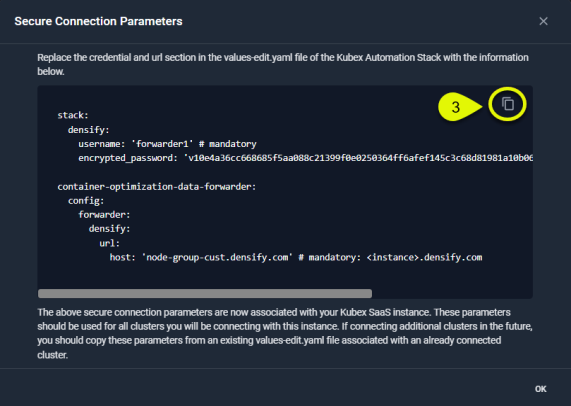
Figure: Paste Connection Parameters into values.edit.yaml
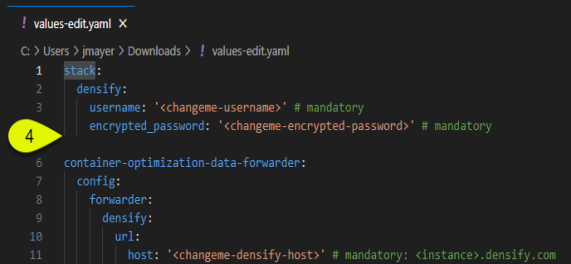
You can use the same credentials for each connection that you create. i.e. you can either save the block of text from the Secure Connection Parameters dialog box or reuse the values.edit.yaml file with the existing credentials and update the cluster details, as required.
Reviewing Data Collection Status
Once the Kubex Automation Stack is installed and configured, data will be collected and stored for detailed analysis. As data is collected the Connections table is populated/updated with the incoming, clusters' status details.
Densify analyzes the collected and aggregated data once daily. Once data collection has been initiated, the status details will appear in this table within approximately 15 minutes, but your cluster will not appear in the tree viewer or until it has been analyzed, within the next 24-hrs. This is also the case for all reports/tabs that
|
Column |
Description |
|---|---|
|
Cluster |
The name of cluster. |
|
First Collection Time |
The date and time on which data was first collected. |
|
Last Collection Time |
The date and time on which data was last collected. |
|
Latest Node Count |
The number of nodes that were discovered during the last collection. |
|
Latest Node Group Count |
The number of node groups that were discovered during the last collection. |
|
Latest Container Count |
The number of containers that were discovered during the last collection. |
|
Cluster Version |
The version number, as obtained from each public cloud provider. |
|
Kubex Automation Stack Version |
The version number of the currently deployed data forwarder. |
The container, node and node group counts in this table are updated each time data is collected. This could be every 15 minutes, depending on how you have configured the cronjob.
Data is not aggregated or averaged, only reported for each cluster that is connected to Densify.