Overview Tab
Overview Tab
#38xxx
The cards on this tab provide a visual overview of a single instance. When navigating the tree viewer, you will see this tab when a single scale set or instance is selected.
Figure: Locating the Overview Tab
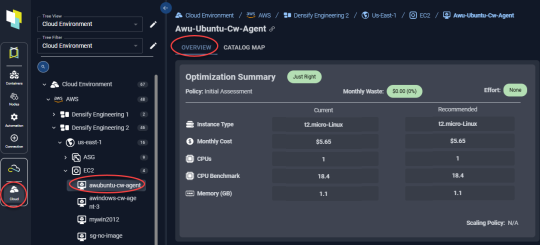
You will also see a popup of this page when you click the "System Name" hyperlink in the AI Analysis Details tab.
Impact Analysis and Recommendation Report
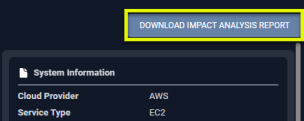
The Impact Analysis and Recommendation report provides a PDF version of the instance details. You can easily share this report with the application owner to share your proposed sizing recommendations.
You can also share the link
|
Figure: Generating the Impact Analysis and Recommendation Report
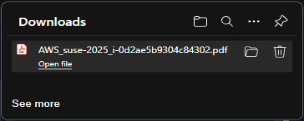
Figure: Downloading the PDF
|
Note: This report is not available for Azure VM Scale Sets. Click the link in the upper corner to download a PDF version of the Impact Analysis and Recommendation Report. When you click the button, a popup opens with a link. You can save or download the file. The filename will be <cloud provider>_<system name>_<system_id>.pdf |
You also have access to the metrics viewer when a single container is selected.
Optimization Summary Block
Identifying details and key metrics are displayed in this block at the top of the page.
Figure: Optimization Summary - Single Instance
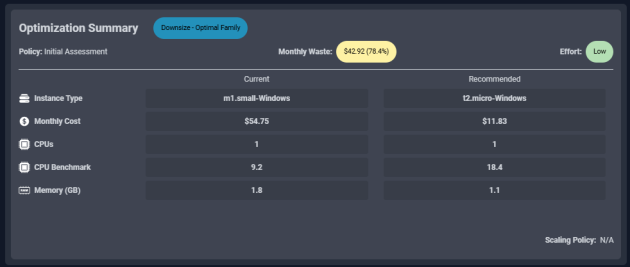
Figure: Optimization Summary - Single Scale Set
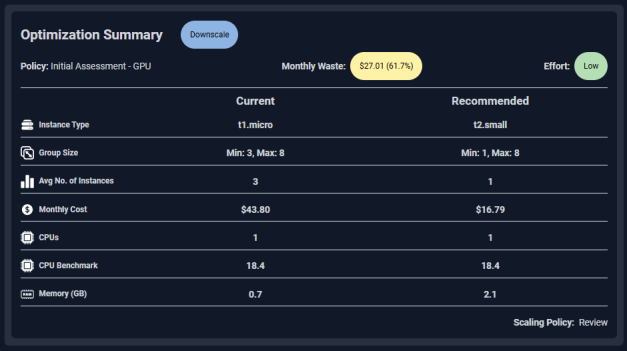
The following details are provided for both the current and the recommended instance type:
|
Column |
Description |
|---|---|
|
Optimization Summary |
Identifies the overall status of the optimization results based on optimization type and potential savings/month. |
|
Monthly Waste |
The amount wasted by not using the recommended instance type. |
|
Effort |
This column describes the effort required to investigate and implement the Densify recommendations. The displayed group effort is an average of all the calculated effort values for each instance (or service) in the group. Values can be one of:
Effort for each instance is calculated by rule-driven analytics based on factors (such as family change, storage change, data quality checks, feature changes, etc.) that can be configured in the policy settings and rule sets which capture best practices. |
|
Instance Type |
The instance type. |
|
Group Size |
The minimum and maximum number of instances for the scale group. This value is only displayed for ASGs and VM Scale Set. |
|
Average No of Instances |
The average instance count on the current and recommended instance type. This value is only displayed for ASGs and VM Scale Set. |
|
Monthly Cost |
The monthly cost of the listed instance type. |
|
CPUs (Cores) |
This is the total CPU allocation, in cores, for the listed instance type. |
|
CPU Benchmark |
The CPU benchmark value for the instance type's specfied CPU. The benchmark value allows you to compare performance of the various hardware. |
|
Memory (GB) |
This is the total memory allocation, in GB, for the listed instance type. |
|
Scaling Policy |
This value indicates whether the scaling mode needs to be reviewed. Possible values are:
|
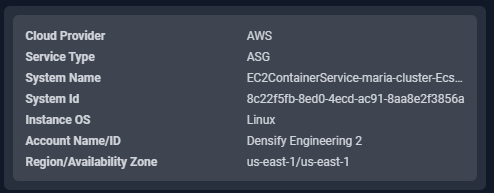
Instance Identification Details
This block summarizes the identification details for this instance.
The following identifying details are provided for each instance:
|
Figure: Instance Identification |
||
|
|
||
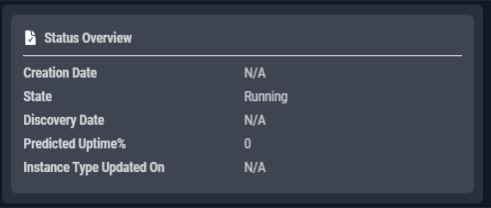
Status Overview
This block summarizes the status of this instance within Cloudex.
|
Figure: Instance Identification |
||
|
|
||
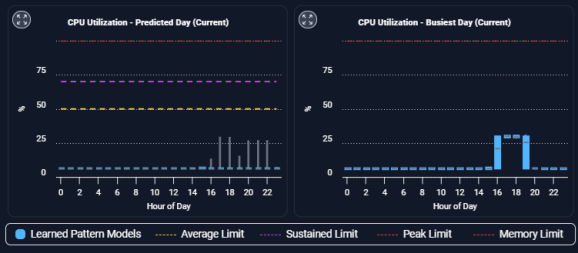
Utilization Charts
The bottom section shows the utilization charts for the selected instance. These charts show hourly min/max and sustained activity for the selected system. The charts show the current and the recommended settings for selected workloads. If the selected instance is "Just Right" then there are no charts for the recommended instance type.
See AI Analysis Details Utilization Charts for details on using these charts to review workload data.
Figure: Utilization Charts
|
|
Expanded Modal View
You can also expand any chart to the modal view and select from the following options for review.

|
Clicking the zoom button opens the chart in a modal view with additional options to view the collected and analyzed data. |
Figure: Chart Modal View
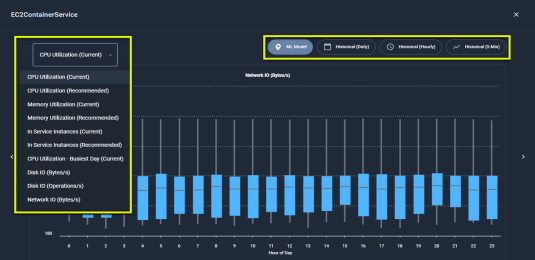
The following options allow you to view all details of your data:
|
Option |
Description |
|---|---|
|
ML Model |
The data is aggregated hourly for the last day (yesterday) and displayed using quartile data. |
|
Historical Daily |
The instance data, is aggregated for a single day. You can see the minimum, maximum, sustained and average values by clicking on any data point. Use the slider at the bottom to select the historical days of data to review. Up to 90 days of data is retained. |
|
Historical Hourly |
The instance data, aggregated for a single hour. Like the historical daily view, you can see the minimum, maximum, sustained and average values by clicking on any data point. Use the slider at the bottom to select the range of data to view. |
|
Historical (5 Min) |
The container's data aggregated into 5-minute samples. This option is available for CPU, Working Set Memory, RSS Memory, Total Memory, and Restarts. |