AI Analysis Details - Instance Details View
AI Analysis Details Columns
#380640
A hyperlink in the AI Analysis Details page opens this page showing significant details of the selected instance provided in a format that is easier to view and compare the current versus the recommended instance types.
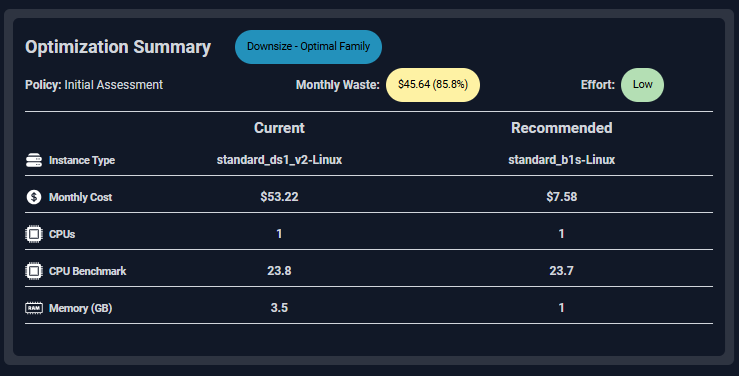
Instance Optimization Details
This card lists the following details for the current instance type.
|
|
These additional details are listed for both instance types for easy comparison.
|
|
Descriptions for all of these values are provided in the AI Analysis Details table.
Impact Analysis and Recommendation Report
The Impact Analysis and Recommendation report provides a PDF version of the instance details. You can easily share this report with the application owner to share your proposed sizing recommendations.
|
Figure: Generating the Impact Analysis and Recommendation Report
Figure: Downloading the PDF
|
Note: This report is not available for Azure VM Scale Sets. Click the link in the upper corner to download a PDF version of the Impact Analysis and Recommendation Report. When you click the button, a popup opens with a link. You can save or download the file. The filename will be <cloud provider>_<system name>_<system_id>.pdf |
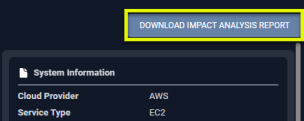
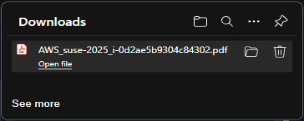
Figure: Instance Optimization Summary Details
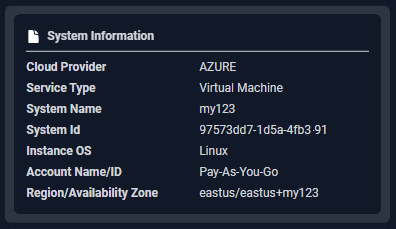
System Information
This card indicates identifying details for the selected instance.
Figure: System Information Card
|
|
|
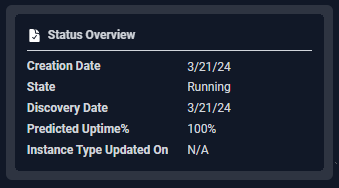
Status Overview
This card indicates indicates the status of the current instance.
Figure: Status Overview
CPU | Memory Request and Limits
These blocks lists the current and recommended allocation settings, based on utilization for the selected container. The values are colour-coded to easily identify savings and wasted resources. A dash (-) indicates no value has been set.
These values are per container if there is more than 1 container defined by the selected manifest
Figure: CPU Request and Limits

Figure: Memory Request and Limits
Total Surplus Resources
These blocks list the aggregated CPU and memory for the selected manifest. The value is colour-coded to easily identify savings. Wasted spend is listed in the last block. A negative value indicates you need to increase the CPU or memory setting to eliminate risk.
Figure: Total Surplus CPU | Memory and Estimated Waste
